Error message
- Deprecated function: array_key_exists(): Using array_key_exists() on objects is deprecated. Use isset() or property_exists() instead in Drupal\Core\Controller\ArgumentResolver\RawParameterValueResolver->supports() (line 18 of core/lib/Drupal/Core/Controller/ArgumentResolver/RawParameterValueResolver.php).
Drupal\Core\Controller\ArgumentResolver\RawParameterValueResolver->supports(Object, Object) (Line: 52) Symfony\Component\HttpKernel\Controller\ArgumentResolver->getArguments(Object, Array) (Line: 94) Drupal\Core\EventSubscriber\EarlyRenderingControllerWrapperSubscriber->onController(Object, 'kernel.controller', Object) call_user_func(Array, Object, 'kernel.controller', Object) (Line: 111) Drupal\Component\EventDispatcher\ContainerAwareEventDispatcher->dispatch('kernel.controller', Object) (Line: 139) Symfony\Component\HttpKernel\HttpKernel->handleRaw(Object, 1) (Line: 68) Symfony\Component\HttpKernel\HttpKernel->handle(Object, 1, 1) (Line: 57) Drupal\Core\StackMiddleware\Session->handle(Object, 1, 1) (Line: 47) Drupal\Core\StackMiddleware\KernelPreHandle->handle(Object, 1, 1) (Line: 47) Drupal\Core\StackMiddleware\ReverseProxyMiddleware->handle(Object, 1, 1) (Line: 52) Drupal\Core\StackMiddleware\NegotiationMiddleware->handle(Object, 1, 1) (Line: 23) Stack\StackedHttpKernel->handle(Object, 1, 1) (Line: 665) Drupal\Core\DrupalKernel->handle(Object) (Line: 19) - Deprecated function: array_key_exists(): Using array_key_exists() on objects is deprecated. Use isset() or property_exists() instead in Drupal\Core\Controller\ArgumentResolver\RawParameterValueResolver->supports() (line 18 of core/lib/Drupal/Core/Controller/ArgumentResolver/RawParameterValueResolver.php).
Drupal\Core\Controller\ArgumentResolver\RawParameterValueResolver->supports(Object, Object) (Line: 52) Symfony\Component\HttpKernel\Controller\ArgumentResolver->getArguments(Object, Array) (Line: 94) Drupal\Core\EventSubscriber\EarlyRenderingControllerWrapperSubscriber->onController(Object, 'kernel.controller', Object) call_user_func(Array, Object, 'kernel.controller', Object) (Line: 111) Drupal\Component\EventDispatcher\ContainerAwareEventDispatcher->dispatch('kernel.controller', Object) (Line: 139) Symfony\Component\HttpKernel\HttpKernel->handleRaw(Object, 1) (Line: 68) Symfony\Component\HttpKernel\HttpKernel->handle(Object, 1, 1) (Line: 57) Drupal\Core\StackMiddleware\Session->handle(Object, 1, 1) (Line: 47) Drupal\Core\StackMiddleware\KernelPreHandle->handle(Object, 1, 1) (Line: 47) Drupal\Core\StackMiddleware\ReverseProxyMiddleware->handle(Object, 1, 1) (Line: 52) Drupal\Core\StackMiddleware\NegotiationMiddleware->handle(Object, 1, 1) (Line: 23) Stack\StackedHttpKernel->handle(Object, 1, 1) (Line: 665) Drupal\Core\DrupalKernel->handle(Object) (Line: 19) - Notice: Trying to access array offset on value of type int in Drupal\Core\Render\Element::children() (line 81 of core/lib/Drupal/Core/Render/Element.php).
Drupal\Core\Render\Element::children(Array) (Line: 250) Drupal\Core\Entity\EntityViewBuilder->buildMultiple(Array) (Line: 220) Drupal\Core\Entity\EntityViewBuilder->build(Array) call_user_func(Array, Array) (Line: 378) Drupal\Core\Render\Renderer->doRender(Array, ) (Line: 195) Drupal\Core\Render\Renderer->render(Array, ) (Line: 226) Drupal\Core\Render\MainContent\HtmlRenderer->Drupal\Core\Render\MainContent\{closure}() (Line: 582) Drupal\Core\Render\Renderer->executeInRenderContext(Object, Object) (Line: 227) Drupal\Core\Render\MainContent\HtmlRenderer->prepare(Array, Object, Object) (Line: 117) Drupal\Core\Render\MainContent\HtmlRenderer->renderResponse(Array, Object, Object) (Line: 90) Drupal\Core\EventSubscriber\MainContentViewSubscriber->onViewRenderArray(Object, 'kernel.view', Object) call_user_func(Array, Object, 'kernel.view', Object) (Line: 111) Drupal\Component\EventDispatcher\ContainerAwareEventDispatcher->dispatch('kernel.view', Object) (Line: 156) Symfony\Component\HttpKernel\HttpKernel->handleRaw(Object, 1) (Line: 68) Symfony\Component\HttpKernel\HttpKernel->handle(Object, 1, 1) (Line: 57) Drupal\Core\StackMiddleware\Session->handle(Object, 1, 1) (Line: 47) Drupal\Core\StackMiddleware\KernelPreHandle->handle(Object, 1, 1) (Line: 47) Drupal\Core\StackMiddleware\ReverseProxyMiddleware->handle(Object, 1, 1) (Line: 52) Drupal\Core\StackMiddleware\NegotiationMiddleware->handle(Object, 1, 1) (Line: 23) Stack\StackedHttpKernel->handle(Object, 1, 1) (Line: 665) Drupal\Core\DrupalKernel->handle(Object) (Line: 19) - Notice: Trying to access array offset on value of type int in Drupal\Core\Render\Element::children() (line 81 of core/lib/Drupal/Core/Render/Element.php).
Drupal\Core\Render\Element::children(Array) (Line: 84) Drupal\Core\Field\FormatterBase->view(Object, 'de') (Line: 262) Drupal\Core\Entity\Entity\EntityViewDisplay->buildMultiple(Array) (Line: 321) Drupal\Core\Entity\EntityViewBuilder->buildComponents(Array, Array, Array, 'full') (Line: 22) Drupal\node\NodeViewBuilder->buildComponents(Array, Array, Array, 'full') (Line: 263) Drupal\Core\Entity\EntityViewBuilder->buildMultiple(Array) (Line: 220) Drupal\Core\Entity\EntityViewBuilder->build(Array) call_user_func(Array, Array) (Line: 378) Drupal\Core\Render\Renderer->doRender(Array, ) (Line: 195) Drupal\Core\Render\Renderer->render(Array, ) (Line: 226) Drupal\Core\Render\MainContent\HtmlRenderer->Drupal\Core\Render\MainContent\{closure}() (Line: 582) Drupal\Core\Render\Renderer->executeInRenderContext(Object, Object) (Line: 227) Drupal\Core\Render\MainContent\HtmlRenderer->prepare(Array, Object, Object) (Line: 117) Drupal\Core\Render\MainContent\HtmlRenderer->renderResponse(Array, Object, Object) (Line: 90) Drupal\Core\EventSubscriber\MainContentViewSubscriber->onViewRenderArray(Object, 'kernel.view', Object) call_user_func(Array, Object, 'kernel.view', Object) (Line: 111) Drupal\Component\EventDispatcher\ContainerAwareEventDispatcher->dispatch('kernel.view', Object) (Line: 156) Symfony\Component\HttpKernel\HttpKernel->handleRaw(Object, 1) (Line: 68) Symfony\Component\HttpKernel\HttpKernel->handle(Object, 1, 1) (Line: 57) Drupal\Core\StackMiddleware\Session->handle(Object, 1, 1) (Line: 47) Drupal\Core\StackMiddleware\KernelPreHandle->handle(Object, 1, 1) (Line: 47) Drupal\Core\StackMiddleware\ReverseProxyMiddleware->handle(Object, 1, 1) (Line: 52) Drupal\Core\StackMiddleware\NegotiationMiddleware->handle(Object, 1, 1) (Line: 23) Stack\StackedHttpKernel->handle(Object, 1, 1) (Line: 665) Drupal\Core\DrupalKernel->handle(Object) (Line: 19) - Notice: Trying to access array offset on value of type int in Drupal\Core\Render\Element::children() (line 81 of core/lib/Drupal/Core/Render/Element.php).
Drupal\Core\Render\Element::children(Array) (Line: 84) Drupal\Core\Field\FormatterBase->view(Object, 'de') (Line: 76) Drupal\Core\Field\Plugin\Field\FieldFormatter\EntityReferenceFormatterBase->view(Object, 'de') (Line: 262) Drupal\Core\Entity\Entity\EntityViewDisplay->buildMultiple(Array) (Line: 321) Drupal\Core\Entity\EntityViewBuilder->buildComponents(Array, Array, Array, 'full') (Line: 22) Drupal\node\NodeViewBuilder->buildComponents(Array, Array, Array, 'full') (Line: 263) Drupal\Core\Entity\EntityViewBuilder->buildMultiple(Array) (Line: 220) Drupal\Core\Entity\EntityViewBuilder->build(Array) call_user_func(Array, Array) (Line: 378) Drupal\Core\Render\Renderer->doRender(Array, ) (Line: 195) Drupal\Core\Render\Renderer->render(Array, ) (Line: 226) Drupal\Core\Render\MainContent\HtmlRenderer->Drupal\Core\Render\MainContent\{closure}() (Line: 582) Drupal\Core\Render\Renderer->executeInRenderContext(Object, Object) (Line: 227) Drupal\Core\Render\MainContent\HtmlRenderer->prepare(Array, Object, Object) (Line: 117) Drupal\Core\Render\MainContent\HtmlRenderer->renderResponse(Array, Object, Object) (Line: 90) Drupal\Core\EventSubscriber\MainContentViewSubscriber->onViewRenderArray(Object, 'kernel.view', Object) call_user_func(Array, Object, 'kernel.view', Object) (Line: 111) Drupal\Component\EventDispatcher\ContainerAwareEventDispatcher->dispatch('kernel.view', Object) (Line: 156) Symfony\Component\HttpKernel\HttpKernel->handleRaw(Object, 1) (Line: 68) Symfony\Component\HttpKernel\HttpKernel->handle(Object, 1, 1) (Line: 57) Drupal\Core\StackMiddleware\Session->handle(Object, 1, 1) (Line: 47) Drupal\Core\StackMiddleware\KernelPreHandle->handle(Object, 1, 1) (Line: 47) Drupal\Core\StackMiddleware\ReverseProxyMiddleware->handle(Object, 1, 1) (Line: 52) Drupal\Core\StackMiddleware\NegotiationMiddleware->handle(Object, 1, 1) (Line: 23) Stack\StackedHttpKernel->handle(Object, 1, 1) (Line: 665) Drupal\Core\DrupalKernel->handle(Object) (Line: 19) - Notice: Trying to access array offset on value of type int in Drupal\Core\Render\Element::children() (line 81 of core/lib/Drupal/Core/Render/Element.php).
Drupal\Core\Render\Element::children(Array) (Line: 84) Drupal\Core\Field\FormatterBase->view(Object, 'de') (Line: 262) Drupal\Core\Entity\Entity\EntityViewDisplay->buildMultiple(Array) (Line: 321) Drupal\Core\Entity\EntityViewBuilder->buildComponents(Array, Array, Array, 'full') (Line: 22) Drupal\node\NodeViewBuilder->buildComponents(Array, Array, Array, 'full') (Line: 263) Drupal\Core\Entity\EntityViewBuilder->buildMultiple(Array) (Line: 220) Drupal\Core\Entity\EntityViewBuilder->build(Array) call_user_func(Array, Array) (Line: 378) Drupal\Core\Render\Renderer->doRender(Array, ) (Line: 195) Drupal\Core\Render\Renderer->render(Array, ) (Line: 226) Drupal\Core\Render\MainContent\HtmlRenderer->Drupal\Core\Render\MainContent\{closure}() (Line: 582) Drupal\Core\Render\Renderer->executeInRenderContext(Object, Object) (Line: 227) Drupal\Core\Render\MainContent\HtmlRenderer->prepare(Array, Object, Object) (Line: 117) Drupal\Core\Render\MainContent\HtmlRenderer->renderResponse(Array, Object, Object) (Line: 90) Drupal\Core\EventSubscriber\MainContentViewSubscriber->onViewRenderArray(Object, 'kernel.view', Object) call_user_func(Array, Object, 'kernel.view', Object) (Line: 111) Drupal\Component\EventDispatcher\ContainerAwareEventDispatcher->dispatch('kernel.view', Object) (Line: 156) Symfony\Component\HttpKernel\HttpKernel->handleRaw(Object, 1) (Line: 68) Symfony\Component\HttpKernel\HttpKernel->handle(Object, 1, 1) (Line: 57) Drupal\Core\StackMiddleware\Session->handle(Object, 1, 1) (Line: 47) Drupal\Core\StackMiddleware\KernelPreHandle->handle(Object, 1, 1) (Line: 47) Drupal\Core\StackMiddleware\ReverseProxyMiddleware->handle(Object, 1, 1) (Line: 52) Drupal\Core\StackMiddleware\NegotiationMiddleware->handle(Object, 1, 1) (Line: 23) Stack\StackedHttpKernel->handle(Object, 1, 1) (Line: 665) Drupal\Core\DrupalKernel->handle(Object) (Line: 19) - Notice: Trying to access array offset on value of type int in Drupal\Core\Render\Element::children() (line 81 of core/lib/Drupal/Core/Render/Element.php).
Drupal\Core\Render\Element::children(Array, 1) (Line: 408) Drupal\Core\Render\Renderer->doRender(Array, ) (Line: 195) Drupal\Core\Render\Renderer->render(Array) (Line: 73) Drupal\Core\Entity\Controller\EntityViewController->buildTitle(Array) call_user_func(Array, Array) (Line: 378) Drupal\Core\Render\Renderer->doRender(Array, ) (Line: 195) Drupal\Core\Render\Renderer->render(Array, ) (Line: 226) Drupal\Core\Render\MainContent\HtmlRenderer->Drupal\Core\Render\MainContent\{closure}() (Line: 582) Drupal\Core\Render\Renderer->executeInRenderContext(Object, Object) (Line: 227) Drupal\Core\Render\MainContent\HtmlRenderer->prepare(Array, Object, Object) (Line: 117) Drupal\Core\Render\MainContent\HtmlRenderer->renderResponse(Array, Object, Object) (Line: 90) Drupal\Core\EventSubscriber\MainContentViewSubscriber->onViewRenderArray(Object, 'kernel.view', Object) call_user_func(Array, Object, 'kernel.view', Object) (Line: 111) Drupal\Component\EventDispatcher\ContainerAwareEventDispatcher->dispatch('kernel.view', Object) (Line: 156) Symfony\Component\HttpKernel\HttpKernel->handleRaw(Object, 1) (Line: 68) Symfony\Component\HttpKernel\HttpKernel->handle(Object, 1, 1) (Line: 57) Drupal\Core\StackMiddleware\Session->handle(Object, 1, 1) (Line: 47) Drupal\Core\StackMiddleware\KernelPreHandle->handle(Object, 1, 1) (Line: 47) Drupal\Core\StackMiddleware\ReverseProxyMiddleware->handle(Object, 1, 1) (Line: 52) Drupal\Core\StackMiddleware\NegotiationMiddleware->handle(Object, 1, 1) (Line: 23) Stack\StackedHttpKernel->handle(Object, 1, 1) (Line: 665) Drupal\Core\DrupalKernel->handle(Object) (Line: 19) - Notice: Trying to access array offset on value of type int in Drupal\Core\Render\Element::children() (line 81 of core/lib/Drupal/Core/Render/Element.php).
Drupal\Core\Render\Element::children(Array, 1) (Line: 408) Drupal\Core\Render\Renderer->doRender(Array, ) (Line: 195) Drupal\Core\Render\Renderer->render(Array) (Line: 611) template_preprocess_node(Array, 'node', Array) (Line: 287) Drupal\Core\Theme\ThemeManager->render('node', Array) (Line: 437) Drupal\Core\Render\Renderer->doRender(Array, ) (Line: 195) Drupal\Core\Render\Renderer->render(Array, ) (Line: 226) Drupal\Core\Render\MainContent\HtmlRenderer->Drupal\Core\Render\MainContent\{closure}() (Line: 582) Drupal\Core\Render\Renderer->executeInRenderContext(Object, Object) (Line: 227) Drupal\Core\Render\MainContent\HtmlRenderer->prepare(Array, Object, Object) (Line: 117) Drupal\Core\Render\MainContent\HtmlRenderer->renderResponse(Array, Object, Object) (Line: 90) Drupal\Core\EventSubscriber\MainContentViewSubscriber->onViewRenderArray(Object, 'kernel.view', Object) call_user_func(Array, Object, 'kernel.view', Object) (Line: 111) Drupal\Component\EventDispatcher\ContainerAwareEventDispatcher->dispatch('kernel.view', Object) (Line: 156) Symfony\Component\HttpKernel\HttpKernel->handleRaw(Object, 1) (Line: 68) Symfony\Component\HttpKernel\HttpKernel->handle(Object, 1, 1) (Line: 57) Drupal\Core\StackMiddleware\Session->handle(Object, 1, 1) (Line: 47) Drupal\Core\StackMiddleware\KernelPreHandle->handle(Object, 1, 1) (Line: 47) Drupal\Core\StackMiddleware\ReverseProxyMiddleware->handle(Object, 1, 1) (Line: 52) Drupal\Core\StackMiddleware\NegotiationMiddleware->handle(Object, 1, 1) (Line: 23) Stack\StackedHttpKernel->handle(Object, 1, 1) (Line: 665) Drupal\Core\DrupalKernel->handle(Object) (Line: 19) - Notice: Trying to access array offset on value of type int in Drupal\Core\Render\Element::children() (line 81 of core/lib/Drupal/Core/Render/Element.php).
Drupal\Core\Render\Element::children(Array, 1) (Line: 408) Drupal\Core\Render\Renderer->doRender(Array, ) (Line: 195) Drupal\Core\Render\Renderer->render(Array) (Line: 613) template_preprocess_node(Array, 'node', Array) (Line: 287) Drupal\Core\Theme\ThemeManager->render('node', Array) (Line: 437) Drupal\Core\Render\Renderer->doRender(Array, ) (Line: 195) Drupal\Core\Render\Renderer->render(Array, ) (Line: 226) Drupal\Core\Render\MainContent\HtmlRenderer->Drupal\Core\Render\MainContent\{closure}() (Line: 582) Drupal\Core\Render\Renderer->executeInRenderContext(Object, Object) (Line: 227) Drupal\Core\Render\MainContent\HtmlRenderer->prepare(Array, Object, Object) (Line: 117) Drupal\Core\Render\MainContent\HtmlRenderer->renderResponse(Array, Object, Object) (Line: 90) Drupal\Core\EventSubscriber\MainContentViewSubscriber->onViewRenderArray(Object, 'kernel.view', Object) call_user_func(Array, Object, 'kernel.view', Object) (Line: 111) Drupal\Component\EventDispatcher\ContainerAwareEventDispatcher->dispatch('kernel.view', Object) (Line: 156) Symfony\Component\HttpKernel\HttpKernel->handleRaw(Object, 1) (Line: 68) Symfony\Component\HttpKernel\HttpKernel->handle(Object, 1, 1) (Line: 57) Drupal\Core\StackMiddleware\Session->handle(Object, 1, 1) (Line: 47) Drupal\Core\StackMiddleware\KernelPreHandle->handle(Object, 1, 1) (Line: 47) Drupal\Core\StackMiddleware\ReverseProxyMiddleware->handle(Object, 1, 1) (Line: 52) Drupal\Core\StackMiddleware\NegotiationMiddleware->handle(Object, 1, 1) (Line: 23) Stack\StackedHttpKernel->handle(Object, 1, 1) (Line: 665) Drupal\Core\DrupalKernel->handle(Object) (Line: 19) - Deprecated function: array_key_exists(): Using array_key_exists() on objects is deprecated. Use isset() or property_exists() instead in Twig_Template->getAttribute() (line 582 of vendor/twig/twig/lib/Twig/Template.php).
Twig_Template->getAttribute(Object, 'bundle', Array) (Line: 44) __TwigTemplate_0cf7bf215c39faf5a00644ac5ce5353d0e73c36d98b0901542b2916c4bd4ff18->doDisplay(Array, Array) (Line: 432) Twig_Template->displayWithErrorHandling(Array, Array) (Line: 403) Twig_Template->display(Array) (Line: 411) Twig_Template->render(Array) (Line: 64) twig_render_template('themes/bootstrap/templates/node/node.html.twig', Array) (Line: 384) Drupal\Core\Theme\ThemeManager->render('node', Array) (Line: 437) Drupal\Core\Render\Renderer->doRender(Array, ) (Line: 195) Drupal\Core\Render\Renderer->render(Array, ) (Line: 226) Drupal\Core\Render\MainContent\HtmlRenderer->Drupal\Core\Render\MainContent\{closure}() (Line: 582) Drupal\Core\Render\Renderer->executeInRenderContext(Object, Object) (Line: 227) Drupal\Core\Render\MainContent\HtmlRenderer->prepare(Array, Object, Object) (Line: 117) Drupal\Core\Render\MainContent\HtmlRenderer->renderResponse(Array, Object, Object) (Line: 90) Drupal\Core\EventSubscriber\MainContentViewSubscriber->onViewRenderArray(Object, 'kernel.view', Object) call_user_func(Array, Object, 'kernel.view', Object) (Line: 111) Drupal\Component\EventDispatcher\ContainerAwareEventDispatcher->dispatch('kernel.view', Object) (Line: 156) Symfony\Component\HttpKernel\HttpKernel->handleRaw(Object, 1) (Line: 68) Symfony\Component\HttpKernel\HttpKernel->handle(Object, 1, 1) (Line: 57) Drupal\Core\StackMiddleware\Session->handle(Object, 1, 1) (Line: 47) Drupal\Core\StackMiddleware\KernelPreHandle->handle(Object, 1, 1) (Line: 47) Drupal\Core\StackMiddleware\ReverseProxyMiddleware->handle(Object, 1, 1) (Line: 52) Drupal\Core\StackMiddleware\NegotiationMiddleware->handle(Object, 1, 1) (Line: 23) Stack\StackedHttpKernel->handle(Object, 1, 1) (Line: 665) Drupal\Core\DrupalKernel->handle(Object) (Line: 19) - Notice: Trying to access array offset on value of type int in Drupal\Core\Render\Element::children() (line 81 of core/lib/Drupal/Core/Render/Element.php).
Drupal\Core\Render\Element::children(Array) (Line: 250) Drupal\Core\Entity\EntityViewBuilder->buildMultiple(Array) (Line: 29) Drupal\block_content\BlockContentViewBuilder->viewMultiple(Array, 'full', NULL) (Line: 17) Drupal\block_content\BlockContentViewBuilder->view(Object, 'full') (Line: 187) Drupal\block_content\Plugin\Block\BlockContentBlock->build() (Line: 203) Drupal\block\BlockViewBuilder::preRender(Array) call_user_func('Drupal\block\BlockViewBuilder::preRender', Array) (Line: 378) Drupal\Core\Render\Renderer->doRender(Array) (Line: 450) Drupal\Core\Render\Renderer->doRender(Array, ) (Line: 195) Drupal\Core\Render\Renderer->render(Array) (Line: 490) Drupal\Core\Template\TwigExtension->escapeFilter(Object, Array, 'html', NULL, 1) (Line: 92) __TwigTemplate_609be39c861ea6de17b6cbe2865d8619637a50a97ff3aa65bfd71eea363e215e->block_navbar(Array, Array) (Line: 215) Twig_Template->displayBlock('navbar', Array, Array) (Line: 57) __TwigTemplate_609be39c861ea6de17b6cbe2865d8619637a50a97ff3aa65bfd71eea363e215e->doDisplay(Array, Array) (Line: 432) Twig_Template->displayWithErrorHandling(Array, Array) (Line: 403) Twig_Template->display(Array) (Line: 411) Twig_Template->render(Array) (Line: 64) twig_render_template('themes/elections_theme/templates/page.html.twig', Array) (Line: 384) Drupal\Core\Theme\ThemeManager->render('page', Array) (Line: 437) Drupal\Core\Render\Renderer->doRender(Array, ) (Line: 195) Drupal\Core\Render\Renderer->render(Array) (Line: 490) Drupal\Core\Template\TwigExtension->escapeFilter(Object, Array, 'html', NULL, 1) (Line: 88) __TwigTemplate_4412c3ba540fa7bbb59a0fe3ac63352e1a0fbde780c5bf73ff49c920397194cb->doDisplay(Array, Array) (Line: 432) Twig_Template->displayWithErrorHandling(Array, Array) (Line: 403) Twig_Template->display(Array) (Line: 411) Twig_Template->render(Array) (Line: 64) twig_render_template('themes/elections_theme/templates/html.html.twig', Array) (Line: 384) Drupal\Core\Theme\ThemeManager->render('html', Array) (Line: 437) Drupal\Core\Render\Renderer->doRender(Array, ) (Line: 195) Drupal\Core\Render\Renderer->render(Array) (Line: 147) Drupal\Core\Render\MainContent\HtmlRenderer->Drupal\Core\Render\MainContent\{closure}() (Line: 582) Drupal\Core\Render\Renderer->executeInRenderContext(Object, Object) (Line: 148) Drupal\Core\Render\MainContent\HtmlRenderer->renderResponse(Array, Object, Object) (Line: 90) Drupal\Core\EventSubscriber\MainContentViewSubscriber->onViewRenderArray(Object, 'kernel.view', Object) call_user_func(Array, Object, 'kernel.view', Object) (Line: 111) Drupal\Component\EventDispatcher\ContainerAwareEventDispatcher->dispatch('kernel.view', Object) (Line: 156) Symfony\Component\HttpKernel\HttpKernel->handleRaw(Object, 1) (Line: 68) Symfony\Component\HttpKernel\HttpKernel->handle(Object, 1, 1) (Line: 57) Drupal\Core\StackMiddleware\Session->handle(Object, 1, 1) (Line: 47) Drupal\Core\StackMiddleware\KernelPreHandle->handle(Object, 1, 1) (Line: 47) Drupal\Core\StackMiddleware\ReverseProxyMiddleware->handle(Object, 1, 1) (Line: 52) Drupal\Core\StackMiddleware\NegotiationMiddleware->handle(Object, 1, 1) (Line: 23) Stack\StackedHttpKernel->handle(Object, 1, 1) (Line: 665) Drupal\Core\DrupalKernel->handle(Object) (Line: 19) - Notice: Trying to access array offset on value of type int in Drupal\Core\Render\Element::children() (line 81 of core/lib/Drupal/Core/Render/Element.php).
Drupal\Core\Render\Element::children(Array) (Line: 84) Drupal\Core\Field\FormatterBase->view(Object, 'de') (Line: 262) Drupal\Core\Entity\Entity\EntityViewDisplay->buildMultiple(Array) (Line: 321) Drupal\Core\Entity\EntityViewBuilder->buildComponents(Array, Array, Array, 'full') (Line: 263) Drupal\Core\Entity\EntityViewBuilder->buildMultiple(Array) (Line: 29) Drupal\block_content\BlockContentViewBuilder->viewMultiple(Array, 'full', NULL) (Line: 17) Drupal\block_content\BlockContentViewBuilder->view(Object, 'full') (Line: 187) Drupal\block_content\Plugin\Block\BlockContentBlock->build() (Line: 203) Drupal\block\BlockViewBuilder::preRender(Array) call_user_func('Drupal\block\BlockViewBuilder::preRender', Array) (Line: 378) Drupal\Core\Render\Renderer->doRender(Array) (Line: 450) Drupal\Core\Render\Renderer->doRender(Array, ) (Line: 195) Drupal\Core\Render\Renderer->render(Array) (Line: 490) Drupal\Core\Template\TwigExtension->escapeFilter(Object, Array, 'html', NULL, 1) (Line: 92) __TwigTemplate_609be39c861ea6de17b6cbe2865d8619637a50a97ff3aa65bfd71eea363e215e->block_navbar(Array, Array) (Line: 215) Twig_Template->displayBlock('navbar', Array, Array) (Line: 57) __TwigTemplate_609be39c861ea6de17b6cbe2865d8619637a50a97ff3aa65bfd71eea363e215e->doDisplay(Array, Array) (Line: 432) Twig_Template->displayWithErrorHandling(Array, Array) (Line: 403) Twig_Template->display(Array) (Line: 411) Twig_Template->render(Array) (Line: 64) twig_render_template('themes/elections_theme/templates/page.html.twig', Array) (Line: 384) Drupal\Core\Theme\ThemeManager->render('page', Array) (Line: 437) Drupal\Core\Render\Renderer->doRender(Array, ) (Line: 195) Drupal\Core\Render\Renderer->render(Array) (Line: 490) Drupal\Core\Template\TwigExtension->escapeFilter(Object, Array, 'html', NULL, 1) (Line: 88) __TwigTemplate_4412c3ba540fa7bbb59a0fe3ac63352e1a0fbde780c5bf73ff49c920397194cb->doDisplay(Array, Array) (Line: 432) Twig_Template->displayWithErrorHandling(Array, Array) (Line: 403) Twig_Template->display(Array) (Line: 411) Twig_Template->render(Array) (Line: 64) twig_render_template('themes/elections_theme/templates/html.html.twig', Array) (Line: 384) Drupal\Core\Theme\ThemeManager->render('html', Array) (Line: 437) Drupal\Core\Render\Renderer->doRender(Array, ) (Line: 195) Drupal\Core\Render\Renderer->render(Array) (Line: 147) Drupal\Core\Render\MainContent\HtmlRenderer->Drupal\Core\Render\MainContent\{closure}() (Line: 582) Drupal\Core\Render\Renderer->executeInRenderContext(Object, Object) (Line: 148) Drupal\Core\Render\MainContent\HtmlRenderer->renderResponse(Array, Object, Object) (Line: 90) Drupal\Core\EventSubscriber\MainContentViewSubscriber->onViewRenderArray(Object, 'kernel.view', Object) call_user_func(Array, Object, 'kernel.view', Object) (Line: 111) Drupal\Component\EventDispatcher\ContainerAwareEventDispatcher->dispatch('kernel.view', Object) (Line: 156) Symfony\Component\HttpKernel\HttpKernel->handleRaw(Object, 1) (Line: 68) Symfony\Component\HttpKernel\HttpKernel->handle(Object, 1, 1) (Line: 57) Drupal\Core\StackMiddleware\Session->handle(Object, 1, 1) (Line: 47) Drupal\Core\StackMiddleware\KernelPreHandle->handle(Object, 1, 1) (Line: 47) Drupal\Core\StackMiddleware\ReverseProxyMiddleware->handle(Object, 1, 1) (Line: 52) Drupal\Core\StackMiddleware\NegotiationMiddleware->handle(Object, 1, 1) (Line: 23) Stack\StackedHttpKernel->handle(Object, 1, 1) (Line: 665) Drupal\Core\DrupalKernel->handle(Object) (Line: 19) - Notice: Trying to access array offset on value of type int in Drupal\Core\Render\Element::children() (line 81 of core/lib/Drupal/Core/Render/Element.php).
Drupal\Core\Render\Element::children(Array, 1) (Line: 408) Drupal\Core\Render\Renderer->doRender(Array) (Line: 450) Drupal\Core\Render\Renderer->doRender(Array, ) (Line: 195) Drupal\Core\Render\Renderer->render(Array) (Line: 490) Drupal\Core\Template\TwigExtension->escapeFilter(Object, Array, 'html', NULL, 1) (Line: 76) __TwigTemplate_21c26d7ff7ddf38a8a999e1f5a2063a501b7e57f0cb13933fe6241db90e52f3b->block_content(Array, Array) (Line: 215) Twig_Template->displayBlock('content', Array, Array) (Line: 65) __TwigTemplate_21c26d7ff7ddf38a8a999e1f5a2063a501b7e57f0cb13933fe6241db90e52f3b->doDisplay(Array, Array) (Line: 432) Twig_Template->displayWithErrorHandling(Array, Array) (Line: 403) Twig_Template->display(Array) (Line: 411) Twig_Template->render(Array) (Line: 64) twig_render_template('themes/bootstrap/templates/block/block.html.twig', Array) (Line: 384) Drupal\Core\Theme\ThemeManager->render('block', Array) (Line: 437) Drupal\Core\Render\Renderer->doRender(Array) (Line: 450) Drupal\Core\Render\Renderer->doRender(Array, ) (Line: 195) Drupal\Core\Render\Renderer->render(Array) (Line: 490) Drupal\Core\Template\TwigExtension->escapeFilter(Object, Array, 'html', NULL, 1) (Line: 92) __TwigTemplate_609be39c861ea6de17b6cbe2865d8619637a50a97ff3aa65bfd71eea363e215e->block_navbar(Array, Array) (Line: 215) Twig_Template->displayBlock('navbar', Array, Array) (Line: 57) __TwigTemplate_609be39c861ea6de17b6cbe2865d8619637a50a97ff3aa65bfd71eea363e215e->doDisplay(Array, Array) (Line: 432) Twig_Template->displayWithErrorHandling(Array, Array) (Line: 403) Twig_Template->display(Array) (Line: 411) Twig_Template->render(Array) (Line: 64) twig_render_template('themes/elections_theme/templates/page.html.twig', Array) (Line: 384) Drupal\Core\Theme\ThemeManager->render('page', Array) (Line: 437) Drupal\Core\Render\Renderer->doRender(Array, ) (Line: 195) Drupal\Core\Render\Renderer->render(Array) (Line: 490) Drupal\Core\Template\TwigExtension->escapeFilter(Object, Array, 'html', NULL, 1) (Line: 88) __TwigTemplate_4412c3ba540fa7bbb59a0fe3ac63352e1a0fbde780c5bf73ff49c920397194cb->doDisplay(Array, Array) (Line: 432) Twig_Template->displayWithErrorHandling(Array, Array) (Line: 403) Twig_Template->display(Array) (Line: 411) Twig_Template->render(Array) (Line: 64) twig_render_template('themes/elections_theme/templates/html.html.twig', Array) (Line: 384) Drupal\Core\Theme\ThemeManager->render('html', Array) (Line: 437) Drupal\Core\Render\Renderer->doRender(Array, ) (Line: 195) Drupal\Core\Render\Renderer->render(Array) (Line: 147) Drupal\Core\Render\MainContent\HtmlRenderer->Drupal\Core\Render\MainContent\{closure}() (Line: 582) Drupal\Core\Render\Renderer->executeInRenderContext(Object, Object) (Line: 148) Drupal\Core\Render\MainContent\HtmlRenderer->renderResponse(Array, Object, Object) (Line: 90) Drupal\Core\EventSubscriber\MainContentViewSubscriber->onViewRenderArray(Object, 'kernel.view', Object) call_user_func(Array, Object, 'kernel.view', Object) (Line: 111) Drupal\Component\EventDispatcher\ContainerAwareEventDispatcher->dispatch('kernel.view', Object) (Line: 156) Symfony\Component\HttpKernel\HttpKernel->handleRaw(Object, 1) (Line: 68) Symfony\Component\HttpKernel\HttpKernel->handle(Object, 1, 1) (Line: 57) Drupal\Core\StackMiddleware\Session->handle(Object, 1, 1) (Line: 47) Drupal\Core\StackMiddleware\KernelPreHandle->handle(Object, 1, 1) (Line: 47) Drupal\Core\StackMiddleware\ReverseProxyMiddleware->handle(Object, 1, 1) (Line: 52) Drupal\Core\StackMiddleware\NegotiationMiddleware->handle(Object, 1, 1) (Line: 23) Stack\StackedHttpKernel->handle(Object, 1, 1) (Line: 665) Drupal\Core\DrupalKernel->handle(Object) (Line: 19) - Notice: Trying to access array offset on value of type int in Drupal\Core\Render\Element::children() (line 81 of core/lib/Drupal/Core/Render/Element.php).
Drupal\Core\Render\Element::children(Array) (Line: 250) Drupal\Core\Entity\EntityViewBuilder->buildMultiple(Array) (Line: 29) Drupal\block_content\BlockContentViewBuilder->viewMultiple(Array, 'full', NULL) (Line: 17) Drupal\block_content\BlockContentViewBuilder->view(Object, 'full') (Line: 187) Drupal\block_content\Plugin\Block\BlockContentBlock->build() (Line: 203) Drupal\block\BlockViewBuilder::preRender(Array) call_user_func('Drupal\block\BlockViewBuilder::preRender', Array) (Line: 378) Drupal\Core\Render\Renderer->doRender(Array) (Line: 450) Drupal\Core\Render\Renderer->doRender(Array, ) (Line: 195) Drupal\Core\Render\Renderer->render(Array) (Line: 490) Drupal\Core\Template\TwigExtension->escapeFilter(Object, Array, 'html', NULL, 1) (Line: 92) __TwigTemplate_609be39c861ea6de17b6cbe2865d8619637a50a97ff3aa65bfd71eea363e215e->block_navbar(Array, Array) (Line: 215) Twig_Template->displayBlock('navbar', Array, Array) (Line: 57) __TwigTemplate_609be39c861ea6de17b6cbe2865d8619637a50a97ff3aa65bfd71eea363e215e->doDisplay(Array, Array) (Line: 432) Twig_Template->displayWithErrorHandling(Array, Array) (Line: 403) Twig_Template->display(Array) (Line: 411) Twig_Template->render(Array) (Line: 64) twig_render_template('themes/elections_theme/templates/page.html.twig', Array) (Line: 384) Drupal\Core\Theme\ThemeManager->render('page', Array) (Line: 437) Drupal\Core\Render\Renderer->doRender(Array, ) (Line: 195) Drupal\Core\Render\Renderer->render(Array) (Line: 490) Drupal\Core\Template\TwigExtension->escapeFilter(Object, Array, 'html', NULL, 1) (Line: 88) __TwigTemplate_4412c3ba540fa7bbb59a0fe3ac63352e1a0fbde780c5bf73ff49c920397194cb->doDisplay(Array, Array) (Line: 432) Twig_Template->displayWithErrorHandling(Array, Array) (Line: 403) Twig_Template->display(Array) (Line: 411) Twig_Template->render(Array) (Line: 64) twig_render_template('themes/elections_theme/templates/html.html.twig', Array) (Line: 384) Drupal\Core\Theme\ThemeManager->render('html', Array) (Line: 437) Drupal\Core\Render\Renderer->doRender(Array, ) (Line: 195) Drupal\Core\Render\Renderer->render(Array) (Line: 147) Drupal\Core\Render\MainContent\HtmlRenderer->Drupal\Core\Render\MainContent\{closure}() (Line: 582) Drupal\Core\Render\Renderer->executeInRenderContext(Object, Object) (Line: 148) Drupal\Core\Render\MainContent\HtmlRenderer->renderResponse(Array, Object, Object) (Line: 90) Drupal\Core\EventSubscriber\MainContentViewSubscriber->onViewRenderArray(Object, 'kernel.view', Object) call_user_func(Array, Object, 'kernel.view', Object) (Line: 111) Drupal\Component\EventDispatcher\ContainerAwareEventDispatcher->dispatch('kernel.view', Object) (Line: 156) Symfony\Component\HttpKernel\HttpKernel->handleRaw(Object, 1) (Line: 68) Symfony\Component\HttpKernel\HttpKernel->handle(Object, 1, 1) (Line: 57) Drupal\Core\StackMiddleware\Session->handle(Object, 1, 1) (Line: 47) Drupal\Core\StackMiddleware\KernelPreHandle->handle(Object, 1, 1) (Line: 47) Drupal\Core\StackMiddleware\ReverseProxyMiddleware->handle(Object, 1, 1) (Line: 52) Drupal\Core\StackMiddleware\NegotiationMiddleware->handle(Object, 1, 1) (Line: 23) Stack\StackedHttpKernel->handle(Object, 1, 1) (Line: 665) Drupal\Core\DrupalKernel->handle(Object) (Line: 19) - Notice: Trying to access array offset on value of type int in Drupal\Core\Render\Element::children() (line 81 of core/lib/Drupal/Core/Render/Element.php).
Drupal\Core\Render\Element::children(Array) (Line: 84) Drupal\Core\Field\FormatterBase->view(Object, 'fr') (Line: 262) Drupal\Core\Entity\Entity\EntityViewDisplay->buildMultiple(Array) (Line: 321) Drupal\Core\Entity\EntityViewBuilder->buildComponents(Array, Array, Array, 'full') (Line: 263) Drupal\Core\Entity\EntityViewBuilder->buildMultiple(Array) (Line: 29) Drupal\block_content\BlockContentViewBuilder->viewMultiple(Array, 'full', NULL) (Line: 17) Drupal\block_content\BlockContentViewBuilder->view(Object, 'full') (Line: 187) Drupal\block_content\Plugin\Block\BlockContentBlock->build() (Line: 203) Drupal\block\BlockViewBuilder::preRender(Array) call_user_func('Drupal\block\BlockViewBuilder::preRender', Array) (Line: 378) Drupal\Core\Render\Renderer->doRender(Array) (Line: 450) Drupal\Core\Render\Renderer->doRender(Array, ) (Line: 195) Drupal\Core\Render\Renderer->render(Array) (Line: 490) Drupal\Core\Template\TwigExtension->escapeFilter(Object, Array, 'html', NULL, 1) (Line: 92) __TwigTemplate_609be39c861ea6de17b6cbe2865d8619637a50a97ff3aa65bfd71eea363e215e->block_navbar(Array, Array) (Line: 215) Twig_Template->displayBlock('navbar', Array, Array) (Line: 57) __TwigTemplate_609be39c861ea6de17b6cbe2865d8619637a50a97ff3aa65bfd71eea363e215e->doDisplay(Array, Array) (Line: 432) Twig_Template->displayWithErrorHandling(Array, Array) (Line: 403) Twig_Template->display(Array) (Line: 411) Twig_Template->render(Array) (Line: 64) twig_render_template('themes/elections_theme/templates/page.html.twig', Array) (Line: 384) Drupal\Core\Theme\ThemeManager->render('page', Array) (Line: 437) Drupal\Core\Render\Renderer->doRender(Array, ) (Line: 195) Drupal\Core\Render\Renderer->render(Array) (Line: 490) Drupal\Core\Template\TwigExtension->escapeFilter(Object, Array, 'html', NULL, 1) (Line: 88) __TwigTemplate_4412c3ba540fa7bbb59a0fe3ac63352e1a0fbde780c5bf73ff49c920397194cb->doDisplay(Array, Array) (Line: 432) Twig_Template->displayWithErrorHandling(Array, Array) (Line: 403) Twig_Template->display(Array) (Line: 411) Twig_Template->render(Array) (Line: 64) twig_render_template('themes/elections_theme/templates/html.html.twig', Array) (Line: 384) Drupal\Core\Theme\ThemeManager->render('html', Array) (Line: 437) Drupal\Core\Render\Renderer->doRender(Array, ) (Line: 195) Drupal\Core\Render\Renderer->render(Array) (Line: 147) Drupal\Core\Render\MainContent\HtmlRenderer->Drupal\Core\Render\MainContent\{closure}() (Line: 582) Drupal\Core\Render\Renderer->executeInRenderContext(Object, Object) (Line: 148) Drupal\Core\Render\MainContent\HtmlRenderer->renderResponse(Array, Object, Object) (Line: 90) Drupal\Core\EventSubscriber\MainContentViewSubscriber->onViewRenderArray(Object, 'kernel.view', Object) call_user_func(Array, Object, 'kernel.view', Object) (Line: 111) Drupal\Component\EventDispatcher\ContainerAwareEventDispatcher->dispatch('kernel.view', Object) (Line: 156) Symfony\Component\HttpKernel\HttpKernel->handleRaw(Object, 1) (Line: 68) Symfony\Component\HttpKernel\HttpKernel->handle(Object, 1, 1) (Line: 57) Drupal\Core\StackMiddleware\Session->handle(Object, 1, 1) (Line: 47) Drupal\Core\StackMiddleware\KernelPreHandle->handle(Object, 1, 1) (Line: 47) Drupal\Core\StackMiddleware\ReverseProxyMiddleware->handle(Object, 1, 1) (Line: 52) Drupal\Core\StackMiddleware\NegotiationMiddleware->handle(Object, 1, 1) (Line: 23) Stack\StackedHttpKernel->handle(Object, 1, 1) (Line: 665) Drupal\Core\DrupalKernel->handle(Object) (Line: 19) - Notice: Trying to access array offset on value of type int in Drupal\Core\Render\Element::children() (line 81 of core/lib/Drupal/Core/Render/Element.php).
Drupal\Core\Render\Element::children(Array, 1) (Line: 408) Drupal\Core\Render\Renderer->doRender(Array) (Line: 450) Drupal\Core\Render\Renderer->doRender(Array, ) (Line: 195) Drupal\Core\Render\Renderer->render(Array) (Line: 490) Drupal\Core\Template\TwigExtension->escapeFilter(Object, Array, 'html', NULL, 1) (Line: 76) __TwigTemplate_21c26d7ff7ddf38a8a999e1f5a2063a501b7e57f0cb13933fe6241db90e52f3b->block_content(Array, Array) (Line: 215) Twig_Template->displayBlock('content', Array, Array) (Line: 65) __TwigTemplate_21c26d7ff7ddf38a8a999e1f5a2063a501b7e57f0cb13933fe6241db90e52f3b->doDisplay(Array, Array) (Line: 432) Twig_Template->displayWithErrorHandling(Array, Array) (Line: 403) Twig_Template->display(Array) (Line: 411) Twig_Template->render(Array) (Line: 64) twig_render_template('themes/bootstrap/templates/block/block.html.twig', Array) (Line: 384) Drupal\Core\Theme\ThemeManager->render('block', Array) (Line: 437) Drupal\Core\Render\Renderer->doRender(Array) (Line: 450) Drupal\Core\Render\Renderer->doRender(Array, ) (Line: 195) Drupal\Core\Render\Renderer->render(Array) (Line: 490) Drupal\Core\Template\TwigExtension->escapeFilter(Object, Array, 'html', NULL, 1) (Line: 92) __TwigTemplate_609be39c861ea6de17b6cbe2865d8619637a50a97ff3aa65bfd71eea363e215e->block_navbar(Array, Array) (Line: 215) Twig_Template->displayBlock('navbar', Array, Array) (Line: 57) __TwigTemplate_609be39c861ea6de17b6cbe2865d8619637a50a97ff3aa65bfd71eea363e215e->doDisplay(Array, Array) (Line: 432) Twig_Template->displayWithErrorHandling(Array, Array) (Line: 403) Twig_Template->display(Array) (Line: 411) Twig_Template->render(Array) (Line: 64) twig_render_template('themes/elections_theme/templates/page.html.twig', Array) (Line: 384) Drupal\Core\Theme\ThemeManager->render('page', Array) (Line: 437) Drupal\Core\Render\Renderer->doRender(Array, ) (Line: 195) Drupal\Core\Render\Renderer->render(Array) (Line: 490) Drupal\Core\Template\TwigExtension->escapeFilter(Object, Array, 'html', NULL, 1) (Line: 88) __TwigTemplate_4412c3ba540fa7bbb59a0fe3ac63352e1a0fbde780c5bf73ff49c920397194cb->doDisplay(Array, Array) (Line: 432) Twig_Template->displayWithErrorHandling(Array, Array) (Line: 403) Twig_Template->display(Array) (Line: 411) Twig_Template->render(Array) (Line: 64) twig_render_template('themes/elections_theme/templates/html.html.twig', Array) (Line: 384) Drupal\Core\Theme\ThemeManager->render('html', Array) (Line: 437) Drupal\Core\Render\Renderer->doRender(Array, ) (Line: 195) Drupal\Core\Render\Renderer->render(Array) (Line: 147) Drupal\Core\Render\MainContent\HtmlRenderer->Drupal\Core\Render\MainContent\{closure}() (Line: 582) Drupal\Core\Render\Renderer->executeInRenderContext(Object, Object) (Line: 148) Drupal\Core\Render\MainContent\HtmlRenderer->renderResponse(Array, Object, Object) (Line: 90) Drupal\Core\EventSubscriber\MainContentViewSubscriber->onViewRenderArray(Object, 'kernel.view', Object) call_user_func(Array, Object, 'kernel.view', Object) (Line: 111) Drupal\Component\EventDispatcher\ContainerAwareEventDispatcher->dispatch('kernel.view', Object) (Line: 156) Symfony\Component\HttpKernel\HttpKernel->handleRaw(Object, 1) (Line: 68) Symfony\Component\HttpKernel\HttpKernel->handle(Object, 1, 1) (Line: 57) Drupal\Core\StackMiddleware\Session->handle(Object, 1, 1) (Line: 47) Drupal\Core\StackMiddleware\KernelPreHandle->handle(Object, 1, 1) (Line: 47) Drupal\Core\StackMiddleware\ReverseProxyMiddleware->handle(Object, 1, 1) (Line: 52) Drupal\Core\StackMiddleware\NegotiationMiddleware->handle(Object, 1, 1) (Line: 23) Stack\StackedHttpKernel->handle(Object, 1, 1) (Line: 665) Drupal\Core\DrupalKernel->handle(Object) (Line: 19) - Notice: Trying to access array offset on value of type int in Drupal\Core\Render\Element::children() (line 81 of core/lib/Drupal/Core/Render/Element.php).
Drupal\Core\Render\Element::children(Array) (Line: 250) Drupal\Core\Entity\EntityViewBuilder->buildMultiple(Array) (Line: 29) Drupal\block_content\BlockContentViewBuilder->viewMultiple(Array, 'full', NULL) (Line: 17) Drupal\block_content\BlockContentViewBuilder->view(Object, 'full') (Line: 187) Drupal\block_content\Plugin\Block\BlockContentBlock->build() (Line: 203) Drupal\block\BlockViewBuilder::preRender(Array) call_user_func('Drupal\block\BlockViewBuilder::preRender', Array) (Line: 378) Drupal\Core\Render\Renderer->doRender(Array) (Line: 450) Drupal\Core\Render\Renderer->doRender(Array, ) (Line: 195) Drupal\Core\Render\Renderer->render(Array) (Line: 490) Drupal\Core\Template\TwigExtension->escapeFilter(Object, Array, 'html', NULL, 1) (Line: 183) __TwigTemplate_609be39c861ea6de17b6cbe2865d8619637a50a97ff3aa65bfd71eea363e215e->block_sidebar_first(Array, Array) (Line: 215) Twig_Template->displayBlock('sidebar_first', Array, Array) (Line: 137) __TwigTemplate_609be39c861ea6de17b6cbe2865d8619637a50a97ff3aa65bfd71eea363e215e->block_main(Array, Array) (Line: 215) Twig_Template->displayBlock('main', Array, Array) (Line: 60) __TwigTemplate_609be39c861ea6de17b6cbe2865d8619637a50a97ff3aa65bfd71eea363e215e->doDisplay(Array, Array) (Line: 432) Twig_Template->displayWithErrorHandling(Array, Array) (Line: 403) Twig_Template->display(Array) (Line: 411) Twig_Template->render(Array) (Line: 64) twig_render_template('themes/elections_theme/templates/page.html.twig', Array) (Line: 384) Drupal\Core\Theme\ThemeManager->render('page', Array) (Line: 437) Drupal\Core\Render\Renderer->doRender(Array, ) (Line: 195) Drupal\Core\Render\Renderer->render(Array) (Line: 490) Drupal\Core\Template\TwigExtension->escapeFilter(Object, Array, 'html', NULL, 1) (Line: 88) __TwigTemplate_4412c3ba540fa7bbb59a0fe3ac63352e1a0fbde780c5bf73ff49c920397194cb->doDisplay(Array, Array) (Line: 432) Twig_Template->displayWithErrorHandling(Array, Array) (Line: 403) Twig_Template->display(Array) (Line: 411) Twig_Template->render(Array) (Line: 64) twig_render_template('themes/elections_theme/templates/html.html.twig', Array) (Line: 384) Drupal\Core\Theme\ThemeManager->render('html', Array) (Line: 437) Drupal\Core\Render\Renderer->doRender(Array, ) (Line: 195) Drupal\Core\Render\Renderer->render(Array) (Line: 147) Drupal\Core\Render\MainContent\HtmlRenderer->Drupal\Core\Render\MainContent\{closure}() (Line: 582) Drupal\Core\Render\Renderer->executeInRenderContext(Object, Object) (Line: 148) Drupal\Core\Render\MainContent\HtmlRenderer->renderResponse(Array, Object, Object) (Line: 90) Drupal\Core\EventSubscriber\MainContentViewSubscriber->onViewRenderArray(Object, 'kernel.view', Object) call_user_func(Array, Object, 'kernel.view', Object) (Line: 111) Drupal\Component\EventDispatcher\ContainerAwareEventDispatcher->dispatch('kernel.view', Object) (Line: 156) Symfony\Component\HttpKernel\HttpKernel->handleRaw(Object, 1) (Line: 68) Symfony\Component\HttpKernel\HttpKernel->handle(Object, 1, 1) (Line: 57) Drupal\Core\StackMiddleware\Session->handle(Object, 1, 1) (Line: 47) Drupal\Core\StackMiddleware\KernelPreHandle->handle(Object, 1, 1) (Line: 47) Drupal\Core\StackMiddleware\ReverseProxyMiddleware->handle(Object, 1, 1) (Line: 52) Drupal\Core\StackMiddleware\NegotiationMiddleware->handle(Object, 1, 1) (Line: 23) Stack\StackedHttpKernel->handle(Object, 1, 1) (Line: 665) Drupal\Core\DrupalKernel->handle(Object) (Line: 19) - Notice: Trying to access array offset on value of type int in Drupal\Core\Render\Element::children() (line 81 of core/lib/Drupal/Core/Render/Element.php).
Drupal\Core\Render\Element::children(Array) (Line: 84) Drupal\Core\Field\FormatterBase->view(Object, 'de') (Line: 262) Drupal\Core\Entity\Entity\EntityViewDisplay->buildMultiple(Array) (Line: 321) Drupal\Core\Entity\EntityViewBuilder->buildComponents(Array, Array, Array, 'full') (Line: 263) Drupal\Core\Entity\EntityViewBuilder->buildMultiple(Array) (Line: 29) Drupal\block_content\BlockContentViewBuilder->viewMultiple(Array, 'full', NULL) (Line: 17) Drupal\block_content\BlockContentViewBuilder->view(Object, 'full') (Line: 187) Drupal\block_content\Plugin\Block\BlockContentBlock->build() (Line: 203) Drupal\block\BlockViewBuilder::preRender(Array) call_user_func('Drupal\block\BlockViewBuilder::preRender', Array) (Line: 378) Drupal\Core\Render\Renderer->doRender(Array) (Line: 450) Drupal\Core\Render\Renderer->doRender(Array, ) (Line: 195) Drupal\Core\Render\Renderer->render(Array) (Line: 490) Drupal\Core\Template\TwigExtension->escapeFilter(Object, Array, 'html', NULL, 1) (Line: 183) __TwigTemplate_609be39c861ea6de17b6cbe2865d8619637a50a97ff3aa65bfd71eea363e215e->block_sidebar_first(Array, Array) (Line: 215) Twig_Template->displayBlock('sidebar_first', Array, Array) (Line: 137) __TwigTemplate_609be39c861ea6de17b6cbe2865d8619637a50a97ff3aa65bfd71eea363e215e->block_main(Array, Array) (Line: 215) Twig_Template->displayBlock('main', Array, Array) (Line: 60) __TwigTemplate_609be39c861ea6de17b6cbe2865d8619637a50a97ff3aa65bfd71eea363e215e->doDisplay(Array, Array) (Line: 432) Twig_Template->displayWithErrorHandling(Array, Array) (Line: 403) Twig_Template->display(Array) (Line: 411) Twig_Template->render(Array) (Line: 64) twig_render_template('themes/elections_theme/templates/page.html.twig', Array) (Line: 384) Drupal\Core\Theme\ThemeManager->render('page', Array) (Line: 437) Drupal\Core\Render\Renderer->doRender(Array, ) (Line: 195) Drupal\Core\Render\Renderer->render(Array) (Line: 490) Drupal\Core\Template\TwigExtension->escapeFilter(Object, Array, 'html', NULL, 1) (Line: 88) __TwigTemplate_4412c3ba540fa7bbb59a0fe3ac63352e1a0fbde780c5bf73ff49c920397194cb->doDisplay(Array, Array) (Line: 432) Twig_Template->displayWithErrorHandling(Array, Array) (Line: 403) Twig_Template->display(Array) (Line: 411) Twig_Template->render(Array) (Line: 64) twig_render_template('themes/elections_theme/templates/html.html.twig', Array) (Line: 384) Drupal\Core\Theme\ThemeManager->render('html', Array) (Line: 437) Drupal\Core\Render\Renderer->doRender(Array, ) (Line: 195) Drupal\Core\Render\Renderer->render(Array) (Line: 147) Drupal\Core\Render\MainContent\HtmlRenderer->Drupal\Core\Render\MainContent\{closure}() (Line: 582) Drupal\Core\Render\Renderer->executeInRenderContext(Object, Object) (Line: 148) Drupal\Core\Render\MainContent\HtmlRenderer->renderResponse(Array, Object, Object) (Line: 90) Drupal\Core\EventSubscriber\MainContentViewSubscriber->onViewRenderArray(Object, 'kernel.view', Object) call_user_func(Array, Object, 'kernel.view', Object) (Line: 111) Drupal\Component\EventDispatcher\ContainerAwareEventDispatcher->dispatch('kernel.view', Object) (Line: 156) Symfony\Component\HttpKernel\HttpKernel->handleRaw(Object, 1) (Line: 68) Symfony\Component\HttpKernel\HttpKernel->handle(Object, 1, 1) (Line: 57) Drupal\Core\StackMiddleware\Session->handle(Object, 1, 1) (Line: 47) Drupal\Core\StackMiddleware\KernelPreHandle->handle(Object, 1, 1) (Line: 47) Drupal\Core\StackMiddleware\ReverseProxyMiddleware->handle(Object, 1, 1) (Line: 52) Drupal\Core\StackMiddleware\NegotiationMiddleware->handle(Object, 1, 1) (Line: 23) Stack\StackedHttpKernel->handle(Object, 1, 1) (Line: 665) Drupal\Core\DrupalKernel->handle(Object) (Line: 19) - Notice: Trying to access array offset on value of type int in Drupal\Core\Render\Element::children() (line 81 of core/lib/Drupal/Core/Render/Element.php).
Drupal\Core\Render\Element::children(Array, 1) (Line: 408) Drupal\Core\Render\Renderer->doRender(Array) (Line: 450) Drupal\Core\Render\Renderer->doRender(Array, ) (Line: 195) Drupal\Core\Render\Renderer->render(Array) (Line: 490) Drupal\Core\Template\TwigExtension->escapeFilter(Object, Array, 'html', NULL, 1) (Line: 76) __TwigTemplate_21c26d7ff7ddf38a8a999e1f5a2063a501b7e57f0cb13933fe6241db90e52f3b->block_content(Array, Array) (Line: 215) Twig_Template->displayBlock('content', Array, Array) (Line: 65) __TwigTemplate_21c26d7ff7ddf38a8a999e1f5a2063a501b7e57f0cb13933fe6241db90e52f3b->doDisplay(Array, Array) (Line: 432) Twig_Template->displayWithErrorHandling(Array, Array) (Line: 403) Twig_Template->display(Array) (Line: 411) Twig_Template->render(Array) (Line: 64) twig_render_template('themes/bootstrap/templates/block/block.html.twig', Array) (Line: 384) Drupal\Core\Theme\ThemeManager->render('block', Array) (Line: 437) Drupal\Core\Render\Renderer->doRender(Array) (Line: 450) Drupal\Core\Render\Renderer->doRender(Array, ) (Line: 195) Drupal\Core\Render\Renderer->render(Array) (Line: 490) Drupal\Core\Template\TwigExtension->escapeFilter(Object, Array, 'html', NULL, 1) (Line: 183) __TwigTemplate_609be39c861ea6de17b6cbe2865d8619637a50a97ff3aa65bfd71eea363e215e->block_sidebar_first(Array, Array) (Line: 215) Twig_Template->displayBlock('sidebar_first', Array, Array) (Line: 137) __TwigTemplate_609be39c861ea6de17b6cbe2865d8619637a50a97ff3aa65bfd71eea363e215e->block_main(Array, Array) (Line: 215) Twig_Template->displayBlock('main', Array, Array) (Line: 60) __TwigTemplate_609be39c861ea6de17b6cbe2865d8619637a50a97ff3aa65bfd71eea363e215e->doDisplay(Array, Array) (Line: 432) Twig_Template->displayWithErrorHandling(Array, Array) (Line: 403) Twig_Template->display(Array) (Line: 411) Twig_Template->render(Array) (Line: 64) twig_render_template('themes/elections_theme/templates/page.html.twig', Array) (Line: 384) Drupal\Core\Theme\ThemeManager->render('page', Array) (Line: 437) Drupal\Core\Render\Renderer->doRender(Array, ) (Line: 195) Drupal\Core\Render\Renderer->render(Array) (Line: 490) Drupal\Core\Template\TwigExtension->escapeFilter(Object, Array, 'html', NULL, 1) (Line: 88) __TwigTemplate_4412c3ba540fa7bbb59a0fe3ac63352e1a0fbde780c5bf73ff49c920397194cb->doDisplay(Array, Array) (Line: 432) Twig_Template->displayWithErrorHandling(Array, Array) (Line: 403) Twig_Template->display(Array) (Line: 411) Twig_Template->render(Array) (Line: 64) twig_render_template('themes/elections_theme/templates/html.html.twig', Array) (Line: 384) Drupal\Core\Theme\ThemeManager->render('html', Array) (Line: 437) Drupal\Core\Render\Renderer->doRender(Array, ) (Line: 195) Drupal\Core\Render\Renderer->render(Array) (Line: 147) Drupal\Core\Render\MainContent\HtmlRenderer->Drupal\Core\Render\MainContent\{closure}() (Line: 582) Drupal\Core\Render\Renderer->executeInRenderContext(Object, Object) (Line: 148) Drupal\Core\Render\MainContent\HtmlRenderer->renderResponse(Array, Object, Object) (Line: 90) Drupal\Core\EventSubscriber\MainContentViewSubscriber->onViewRenderArray(Object, 'kernel.view', Object) call_user_func(Array, Object, 'kernel.view', Object) (Line: 111) Drupal\Component\EventDispatcher\ContainerAwareEventDispatcher->dispatch('kernel.view', Object) (Line: 156) Symfony\Component\HttpKernel\HttpKernel->handleRaw(Object, 1) (Line: 68) Symfony\Component\HttpKernel\HttpKernel->handle(Object, 1, 1) (Line: 57) Drupal\Core\StackMiddleware\Session->handle(Object, 1, 1) (Line: 47) Drupal\Core\StackMiddleware\KernelPreHandle->handle(Object, 1, 1) (Line: 47) Drupal\Core\StackMiddleware\ReverseProxyMiddleware->handle(Object, 1, 1) (Line: 52) Drupal\Core\StackMiddleware\NegotiationMiddleware->handle(Object, 1, 1) (Line: 23) Stack\StackedHttpKernel->handle(Object, 1, 1) (Line: 665) Drupal\Core\DrupalKernel->handle(Object) (Line: 19) - Notice: Trying to access array offset on value of type int in Drupal\Core\Render\Element::children() (line 81 of core/lib/Drupal/Core/Render/Element.php).
Drupal\Core\Render\Element::children(Array) (Line: 250) Drupal\Core\Entity\EntityViewBuilder->buildMultiple(Array) (Line: 29) Drupal\block_content\BlockContentViewBuilder->viewMultiple(Array, 'full', NULL) (Line: 17) Drupal\block_content\BlockContentViewBuilder->view(Object, 'full') (Line: 187) Drupal\block_content\Plugin\Block\BlockContentBlock->build() (Line: 203) Drupal\block\BlockViewBuilder::preRender(Array) call_user_func('Drupal\block\BlockViewBuilder::preRender', Array) (Line: 378) Drupal\Core\Render\Renderer->doRender(Array) (Line: 450) Drupal\Core\Render\Renderer->doRender(Array, ) (Line: 195) Drupal\Core\Render\Renderer->render(Array) (Line: 490) Drupal\Core\Template\TwigExtension->escapeFilter(Object, Array, 'html', NULL, 1) (Line: 183) __TwigTemplate_609be39c861ea6de17b6cbe2865d8619637a50a97ff3aa65bfd71eea363e215e->block_sidebar_first(Array, Array) (Line: 215) Twig_Template->displayBlock('sidebar_first', Array, Array) (Line: 137) __TwigTemplate_609be39c861ea6de17b6cbe2865d8619637a50a97ff3aa65bfd71eea363e215e->block_main(Array, Array) (Line: 215) Twig_Template->displayBlock('main', Array, Array) (Line: 60) __TwigTemplate_609be39c861ea6de17b6cbe2865d8619637a50a97ff3aa65bfd71eea363e215e->doDisplay(Array, Array) (Line: 432) Twig_Template->displayWithErrorHandling(Array, Array) (Line: 403) Twig_Template->display(Array) (Line: 411) Twig_Template->render(Array) (Line: 64) twig_render_template('themes/elections_theme/templates/page.html.twig', Array) (Line: 384) Drupal\Core\Theme\ThemeManager->render('page', Array) (Line: 437) Drupal\Core\Render\Renderer->doRender(Array, ) (Line: 195) Drupal\Core\Render\Renderer->render(Array) (Line: 490) Drupal\Core\Template\TwigExtension->escapeFilter(Object, Array, 'html', NULL, 1) (Line: 88) __TwigTemplate_4412c3ba540fa7bbb59a0fe3ac63352e1a0fbde780c5bf73ff49c920397194cb->doDisplay(Array, Array) (Line: 432) Twig_Template->displayWithErrorHandling(Array, Array) (Line: 403) Twig_Template->display(Array) (Line: 411) Twig_Template->render(Array) (Line: 64) twig_render_template('themes/elections_theme/templates/html.html.twig', Array) (Line: 384) Drupal\Core\Theme\ThemeManager->render('html', Array) (Line: 437) Drupal\Core\Render\Renderer->doRender(Array, ) (Line: 195) Drupal\Core\Render\Renderer->render(Array) (Line: 147) Drupal\Core\Render\MainContent\HtmlRenderer->Drupal\Core\Render\MainContent\{closure}() (Line: 582) Drupal\Core\Render\Renderer->executeInRenderContext(Object, Object) (Line: 148) Drupal\Core\Render\MainContent\HtmlRenderer->renderResponse(Array, Object, Object) (Line: 90) Drupal\Core\EventSubscriber\MainContentViewSubscriber->onViewRenderArray(Object, 'kernel.view', Object) call_user_func(Array, Object, 'kernel.view', Object) (Line: 111) Drupal\Component\EventDispatcher\ContainerAwareEventDispatcher->dispatch('kernel.view', Object) (Line: 156) Symfony\Component\HttpKernel\HttpKernel->handleRaw(Object, 1) (Line: 68) Symfony\Component\HttpKernel\HttpKernel->handle(Object, 1, 1) (Line: 57) Drupal\Core\StackMiddleware\Session->handle(Object, 1, 1) (Line: 47) Drupal\Core\StackMiddleware\KernelPreHandle->handle(Object, 1, 1) (Line: 47) Drupal\Core\StackMiddleware\ReverseProxyMiddleware->handle(Object, 1, 1) (Line: 52) Drupal\Core\StackMiddleware\NegotiationMiddleware->handle(Object, 1, 1) (Line: 23) Stack\StackedHttpKernel->handle(Object, 1, 1) (Line: 665) Drupal\Core\DrupalKernel->handle(Object) (Line: 19) - Notice: Trying to access array offset on value of type int in Drupal\Core\Render\Element::children() (line 81 of core/lib/Drupal/Core/Render/Element.php).
Drupal\Core\Render\Element::children(Array) (Line: 84) Drupal\Core\Field\FormatterBase->view(Object, 'de') (Line: 262) Drupal\Core\Entity\Entity\EntityViewDisplay->buildMultiple(Array) (Line: 321) Drupal\Core\Entity\EntityViewBuilder->buildComponents(Array, Array, Array, 'full') (Line: 263) Drupal\Core\Entity\EntityViewBuilder->buildMultiple(Array) (Line: 29) Drupal\block_content\BlockContentViewBuilder->viewMultiple(Array, 'full', NULL) (Line: 17) Drupal\block_content\BlockContentViewBuilder->view(Object, 'full') (Line: 187) Drupal\block_content\Plugin\Block\BlockContentBlock->build() (Line: 203) Drupal\block\BlockViewBuilder::preRender(Array) call_user_func('Drupal\block\BlockViewBuilder::preRender', Array) (Line: 378) Drupal\Core\Render\Renderer->doRender(Array) (Line: 450) Drupal\Core\Render\Renderer->doRender(Array, ) (Line: 195) Drupal\Core\Render\Renderer->render(Array) (Line: 490) Drupal\Core\Template\TwigExtension->escapeFilter(Object, Array, 'html', NULL, 1) (Line: 183) __TwigTemplate_609be39c861ea6de17b6cbe2865d8619637a50a97ff3aa65bfd71eea363e215e->block_sidebar_first(Array, Array) (Line: 215) Twig_Template->displayBlock('sidebar_first', Array, Array) (Line: 137) __TwigTemplate_609be39c861ea6de17b6cbe2865d8619637a50a97ff3aa65bfd71eea363e215e->block_main(Array, Array) (Line: 215) Twig_Template->displayBlock('main', Array, Array) (Line: 60) __TwigTemplate_609be39c861ea6de17b6cbe2865d8619637a50a97ff3aa65bfd71eea363e215e->doDisplay(Array, Array) (Line: 432) Twig_Template->displayWithErrorHandling(Array, Array) (Line: 403) Twig_Template->display(Array) (Line: 411) Twig_Template->render(Array) (Line: 64) twig_render_template('themes/elections_theme/templates/page.html.twig', Array) (Line: 384) Drupal\Core\Theme\ThemeManager->render('page', Array) (Line: 437) Drupal\Core\Render\Renderer->doRender(Array, ) (Line: 195) Drupal\Core\Render\Renderer->render(Array) (Line: 490) Drupal\Core\Template\TwigExtension->escapeFilter(Object, Array, 'html', NULL, 1) (Line: 88) __TwigTemplate_4412c3ba540fa7bbb59a0fe3ac63352e1a0fbde780c5bf73ff49c920397194cb->doDisplay(Array, Array) (Line: 432) Twig_Template->displayWithErrorHandling(Array, Array) (Line: 403) Twig_Template->display(Array) (Line: 411) Twig_Template->render(Array) (Line: 64) twig_render_template('themes/elections_theme/templates/html.html.twig', Array) (Line: 384) Drupal\Core\Theme\ThemeManager->render('html', Array) (Line: 437) Drupal\Core\Render\Renderer->doRender(Array, ) (Line: 195) Drupal\Core\Render\Renderer->render(Array) (Line: 147) Drupal\Core\Render\MainContent\HtmlRenderer->Drupal\Core\Render\MainContent\{closure}() (Line: 582) Drupal\Core\Render\Renderer->executeInRenderContext(Object, Object) (Line: 148) Drupal\Core\Render\MainContent\HtmlRenderer->renderResponse(Array, Object, Object) (Line: 90) Drupal\Core\EventSubscriber\MainContentViewSubscriber->onViewRenderArray(Object, 'kernel.view', Object) call_user_func(Array, Object, 'kernel.view', Object) (Line: 111) Drupal\Component\EventDispatcher\ContainerAwareEventDispatcher->dispatch('kernel.view', Object) (Line: 156) Symfony\Component\HttpKernel\HttpKernel->handleRaw(Object, 1) (Line: 68) Symfony\Component\HttpKernel\HttpKernel->handle(Object, 1, 1) (Line: 57) Drupal\Core\StackMiddleware\Session->handle(Object, 1, 1) (Line: 47) Drupal\Core\StackMiddleware\KernelPreHandle->handle(Object, 1, 1) (Line: 47) Drupal\Core\StackMiddleware\ReverseProxyMiddleware->handle(Object, 1, 1) (Line: 52) Drupal\Core\StackMiddleware\NegotiationMiddleware->handle(Object, 1, 1) (Line: 23) Stack\StackedHttpKernel->handle(Object, 1, 1) (Line: 665) Drupal\Core\DrupalKernel->handle(Object) (Line: 19) - Notice: Trying to access array offset on value of type int in Drupal\Core\Render\Element::children() (line 81 of core/lib/Drupal/Core/Render/Element.php).
Drupal\Core\Render\Element::children(Array, 1) (Line: 408) Drupal\Core\Render\Renderer->doRender(Array) (Line: 450) Drupal\Core\Render\Renderer->doRender(Array, ) (Line: 195) Drupal\Core\Render\Renderer->render(Array) (Line: 490) Drupal\Core\Template\TwigExtension->escapeFilter(Object, Array, 'html', NULL, 1) (Line: 76) __TwigTemplate_21c26d7ff7ddf38a8a999e1f5a2063a501b7e57f0cb13933fe6241db90e52f3b->block_content(Array, Array) (Line: 215) Twig_Template->displayBlock('content', Array, Array) (Line: 65) __TwigTemplate_21c26d7ff7ddf38a8a999e1f5a2063a501b7e57f0cb13933fe6241db90e52f3b->doDisplay(Array, Array) (Line: 432) Twig_Template->displayWithErrorHandling(Array, Array) (Line: 403) Twig_Template->display(Array) (Line: 411) Twig_Template->render(Array) (Line: 64) twig_render_template('themes/bootstrap/templates/block/block.html.twig', Array) (Line: 384) Drupal\Core\Theme\ThemeManager->render('block', Array) (Line: 437) Drupal\Core\Render\Renderer->doRender(Array) (Line: 450) Drupal\Core\Render\Renderer->doRender(Array, ) (Line: 195) Drupal\Core\Render\Renderer->render(Array) (Line: 490) Drupal\Core\Template\TwigExtension->escapeFilter(Object, Array, 'html', NULL, 1) (Line: 183) __TwigTemplate_609be39c861ea6de17b6cbe2865d8619637a50a97ff3aa65bfd71eea363e215e->block_sidebar_first(Array, Array) (Line: 215) Twig_Template->displayBlock('sidebar_first', Array, Array) (Line: 137) __TwigTemplate_609be39c861ea6de17b6cbe2865d8619637a50a97ff3aa65bfd71eea363e215e->block_main(Array, Array) (Line: 215) Twig_Template->displayBlock('main', Array, Array) (Line: 60) __TwigTemplate_609be39c861ea6de17b6cbe2865d8619637a50a97ff3aa65bfd71eea363e215e->doDisplay(Array, Array) (Line: 432) Twig_Template->displayWithErrorHandling(Array, Array) (Line: 403) Twig_Template->display(Array) (Line: 411) Twig_Template->render(Array) (Line: 64) twig_render_template('themes/elections_theme/templates/page.html.twig', Array) (Line: 384) Drupal\Core\Theme\ThemeManager->render('page', Array) (Line: 437) Drupal\Core\Render\Renderer->doRender(Array, ) (Line: 195) Drupal\Core\Render\Renderer->render(Array) (Line: 490) Drupal\Core\Template\TwigExtension->escapeFilter(Object, Array, 'html', NULL, 1) (Line: 88) __TwigTemplate_4412c3ba540fa7bbb59a0fe3ac63352e1a0fbde780c5bf73ff49c920397194cb->doDisplay(Array, Array) (Line: 432) Twig_Template->displayWithErrorHandling(Array, Array) (Line: 403) Twig_Template->display(Array) (Line: 411) Twig_Template->render(Array) (Line: 64) twig_render_template('themes/elections_theme/templates/html.html.twig', Array) (Line: 384) Drupal\Core\Theme\ThemeManager->render('html', Array) (Line: 437) Drupal\Core\Render\Renderer->doRender(Array, ) (Line: 195) Drupal\Core\Render\Renderer->render(Array) (Line: 147) Drupal\Core\Render\MainContent\HtmlRenderer->Drupal\Core\Render\MainContent\{closure}() (Line: 582) Drupal\Core\Render\Renderer->executeInRenderContext(Object, Object) (Line: 148) Drupal\Core\Render\MainContent\HtmlRenderer->renderResponse(Array, Object, Object) (Line: 90) Drupal\Core\EventSubscriber\MainContentViewSubscriber->onViewRenderArray(Object, 'kernel.view', Object) call_user_func(Array, Object, 'kernel.view', Object) (Line: 111) Drupal\Component\EventDispatcher\ContainerAwareEventDispatcher->dispatch('kernel.view', Object) (Line: 156) Symfony\Component\HttpKernel\HttpKernel->handleRaw(Object, 1) (Line: 68) Symfony\Component\HttpKernel\HttpKernel->handle(Object, 1, 1) (Line: 57) Drupal\Core\StackMiddleware\Session->handle(Object, 1, 1) (Line: 47) Drupal\Core\StackMiddleware\KernelPreHandle->handle(Object, 1, 1) (Line: 47) Drupal\Core\StackMiddleware\ReverseProxyMiddleware->handle(Object, 1, 1) (Line: 52) Drupal\Core\StackMiddleware\NegotiationMiddleware->handle(Object, 1, 1) (Line: 23) Stack\StackedHttpKernel->handle(Object, 1, 1) (Line: 665) Drupal\Core\DrupalKernel->handle(Object) (Line: 19) - Deprecated function: array_key_exists(): Using array_key_exists() on objects is deprecated. Use isset() or property_exists() instead in Drupal\Core\Controller\ArgumentResolver\RawParameterValueResolver->supports() (line 18 of core/lib/Drupal/Core/Controller/ArgumentResolver/RawParameterValueResolver.php).
Drupal\Core\Controller\ArgumentResolver\RawParameterValueResolver->supports(Object, Object) (Line: 52) Symfony\Component\HttpKernel\Controller\ArgumentResolver->getArguments(Object, Array) (Line: 193) Drupal\Core\Menu\LocalTaskManager->getTitle(Object) (Line: 343) Drupal\Core\Menu\LocalTaskManager->getTasksBuild('entity.node.canonical', Object) (Line: 378) Drupal\Core\Menu\LocalTaskManager->getLocalTasks('entity.node.canonical', 0) (Line: 95) Drupal\Core\Menu\Plugin\Block\LocalTasksBlock->build() (Line: 203) Drupal\block\BlockViewBuilder::preRender(Array) call_user_func('Drupal\block\BlockViewBuilder::preRender', Array) (Line: 378) Drupal\Core\Render\Renderer->doRender(Array) (Line: 450) Drupal\Core\Render\Renderer->doRender(Array, ) (Line: 195) Drupal\Core\Render\Renderer->render(Array) (Line: 490) Drupal\Core\Template\TwigExtension->escapeFilter(Object, Array, 'html', NULL, 1) (Line: 211) __TwigTemplate_609be39c861ea6de17b6cbe2865d8619637a50a97ff3aa65bfd71eea363e215e->block_content(Array, Array) (Line: 215) Twig_Template->displayBlock('content', Array, Array) (Line: 160) __TwigTemplate_609be39c861ea6de17b6cbe2865d8619637a50a97ff3aa65bfd71eea363e215e->block_main(Array, Array) (Line: 215) Twig_Template->displayBlock('main', Array, Array) (Line: 60) __TwigTemplate_609be39c861ea6de17b6cbe2865d8619637a50a97ff3aa65bfd71eea363e215e->doDisplay(Array, Array) (Line: 432) Twig_Template->displayWithErrorHandling(Array, Array) (Line: 403) Twig_Template->display(Array) (Line: 411) Twig_Template->render(Array) (Line: 64) twig_render_template('themes/elections_theme/templates/page.html.twig', Array) (Line: 384) Drupal\Core\Theme\ThemeManager->render('page', Array) (Line: 437) Drupal\Core\Render\Renderer->doRender(Array, ) (Line: 195) Drupal\Core\Render\Renderer->render(Array) (Line: 490) Drupal\Core\Template\TwigExtension->escapeFilter(Object, Array, 'html', NULL, 1) (Line: 88) __TwigTemplate_4412c3ba540fa7bbb59a0fe3ac63352e1a0fbde780c5bf73ff49c920397194cb->doDisplay(Array, Array) (Line: 432) Twig_Template->displayWithErrorHandling(Array, Array) (Line: 403) Twig_Template->display(Array) (Line: 411) Twig_Template->render(Array) (Line: 64) twig_render_template('themes/elections_theme/templates/html.html.twig', Array) (Line: 384) Drupal\Core\Theme\ThemeManager->render('html', Array) (Line: 437) Drupal\Core\Render\Renderer->doRender(Array, ) (Line: 195) Drupal\Core\Render\Renderer->render(Array) (Line: 147) Drupal\Core\Render\MainContent\HtmlRenderer->Drupal\Core\Render\MainContent\{closure}() (Line: 582) Drupal\Core\Render\Renderer->executeInRenderContext(Object, Object) (Line: 148) Drupal\Core\Render\MainContent\HtmlRenderer->renderResponse(Array, Object, Object) (Line: 90) Drupal\Core\EventSubscriber\MainContentViewSubscriber->onViewRenderArray(Object, 'kernel.view', Object) call_user_func(Array, Object, 'kernel.view', Object) (Line: 111) Drupal\Component\EventDispatcher\ContainerAwareEventDispatcher->dispatch('kernel.view', Object) (Line: 156) Symfony\Component\HttpKernel\HttpKernel->handleRaw(Object, 1) (Line: 68) Symfony\Component\HttpKernel\HttpKernel->handle(Object, 1, 1) (Line: 57) Drupal\Core\StackMiddleware\Session->handle(Object, 1, 1) (Line: 47) Drupal\Core\StackMiddleware\KernelPreHandle->handle(Object, 1, 1) (Line: 47) Drupal\Core\StackMiddleware\ReverseProxyMiddleware->handle(Object, 1, 1) (Line: 52) Drupal\Core\StackMiddleware\NegotiationMiddleware->handle(Object, 1, 1) (Line: 23) Stack\StackedHttpKernel->handle(Object, 1, 1) (Line: 665) Drupal\Core\DrupalKernel->handle(Object) (Line: 19) - Deprecated function: array_key_exists(): Using array_key_exists() on objects is deprecated. Use isset() or property_exists() instead in Drupal\Core\Controller\ArgumentResolver\RawParameterValueResolver->supports() (line 18 of core/lib/Drupal/Core/Controller/ArgumentResolver/RawParameterValueResolver.php).
Drupal\Core\Controller\ArgumentResolver\RawParameterValueResolver->supports(Object, Object) (Line: 52) Symfony\Component\HttpKernel\Controller\ArgumentResolver->getArguments(Object, Array) (Line: 193) Drupal\Core\Menu\LocalTaskManager->getTitle(Object) (Line: 343) Drupal\Core\Menu\LocalTaskManager->getTasksBuild('entity.node.canonical', Object) (Line: 378) Drupal\Core\Menu\LocalTaskManager->getLocalTasks('entity.node.canonical', 0) (Line: 95) Drupal\Core\Menu\Plugin\Block\LocalTasksBlock->build() (Line: 203) Drupal\block\BlockViewBuilder::preRender(Array) call_user_func('Drupal\block\BlockViewBuilder::preRender', Array) (Line: 378) Drupal\Core\Render\Renderer->doRender(Array) (Line: 450) Drupal\Core\Render\Renderer->doRender(Array, ) (Line: 195) Drupal\Core\Render\Renderer->render(Array) (Line: 490) Drupal\Core\Template\TwigExtension->escapeFilter(Object, Array, 'html', NULL, 1) (Line: 211) __TwigTemplate_609be39c861ea6de17b6cbe2865d8619637a50a97ff3aa65bfd71eea363e215e->block_content(Array, Array) (Line: 215) Twig_Template->displayBlock('content', Array, Array) (Line: 160) __TwigTemplate_609be39c861ea6de17b6cbe2865d8619637a50a97ff3aa65bfd71eea363e215e->block_main(Array, Array) (Line: 215) Twig_Template->displayBlock('main', Array, Array) (Line: 60) __TwigTemplate_609be39c861ea6de17b6cbe2865d8619637a50a97ff3aa65bfd71eea363e215e->doDisplay(Array, Array) (Line: 432) Twig_Template->displayWithErrorHandling(Array, Array) (Line: 403) Twig_Template->display(Array) (Line: 411) Twig_Template->render(Array) (Line: 64) twig_render_template('themes/elections_theme/templates/page.html.twig', Array) (Line: 384) Drupal\Core\Theme\ThemeManager->render('page', Array) (Line: 437) Drupal\Core\Render\Renderer->doRender(Array, ) (Line: 195) Drupal\Core\Render\Renderer->render(Array) (Line: 490) Drupal\Core\Template\TwigExtension->escapeFilter(Object, Array, 'html', NULL, 1) (Line: 88) __TwigTemplate_4412c3ba540fa7bbb59a0fe3ac63352e1a0fbde780c5bf73ff49c920397194cb->doDisplay(Array, Array) (Line: 432) Twig_Template->displayWithErrorHandling(Array, Array) (Line: 403) Twig_Template->display(Array) (Line: 411) Twig_Template->render(Array) (Line: 64) twig_render_template('themes/elections_theme/templates/html.html.twig', Array) (Line: 384) Drupal\Core\Theme\ThemeManager->render('html', Array) (Line: 437) Drupal\Core\Render\Renderer->doRender(Array, ) (Line: 195) Drupal\Core\Render\Renderer->render(Array) (Line: 147) Drupal\Core\Render\MainContent\HtmlRenderer->Drupal\Core\Render\MainContent\{closure}() (Line: 582) Drupal\Core\Render\Renderer->executeInRenderContext(Object, Object) (Line: 148) Drupal\Core\Render\MainContent\HtmlRenderer->renderResponse(Array, Object, Object) (Line: 90) Drupal\Core\EventSubscriber\MainContentViewSubscriber->onViewRenderArray(Object, 'kernel.view', Object) call_user_func(Array, Object, 'kernel.view', Object) (Line: 111) Drupal\Component\EventDispatcher\ContainerAwareEventDispatcher->dispatch('kernel.view', Object) (Line: 156) Symfony\Component\HttpKernel\HttpKernel->handleRaw(Object, 1) (Line: 68) Symfony\Component\HttpKernel\HttpKernel->handle(Object, 1, 1) (Line: 57) Drupal\Core\StackMiddleware\Session->handle(Object, 1, 1) (Line: 47) Drupal\Core\StackMiddleware\KernelPreHandle->handle(Object, 1, 1) (Line: 47) Drupal\Core\StackMiddleware\ReverseProxyMiddleware->handle(Object, 1, 1) (Line: 52) Drupal\Core\StackMiddleware\NegotiationMiddleware->handle(Object, 1, 1) (Line: 23) Stack\StackedHttpKernel->handle(Object, 1, 1) (Line: 665) Drupal\Core\DrupalKernel->handle(Object) (Line: 19) - Deprecated function: array_key_exists(): Using array_key_exists() on objects is deprecated. Use isset() or property_exists() instead in Drupal\Core\Controller\ArgumentResolver\RawParameterValueResolver->supports() (line 18 of core/lib/Drupal/Core/Controller/ArgumentResolver/RawParameterValueResolver.php).
Drupal\Core\Controller\ArgumentResolver\RawParameterValueResolver->supports(Object, Object) (Line: 52) Symfony\Component\HttpKernel\Controller\ArgumentResolver->getArguments(Object, Array) (Line: 193) Drupal\Core\Menu\LocalTaskManager->getTitle(Object) (Line: 343) Drupal\Core\Menu\LocalTaskManager->getTasksBuild('entity.node.canonical', Object) (Line: 378) Drupal\Core\Menu\LocalTaskManager->getLocalTasks('entity.node.canonical', 0) (Line: 95) Drupal\Core\Menu\Plugin\Block\LocalTasksBlock->build() (Line: 203) Drupal\block\BlockViewBuilder::preRender(Array) call_user_func('Drupal\block\BlockViewBuilder::preRender', Array) (Line: 378) Drupal\Core\Render\Renderer->doRender(Array) (Line: 450) Drupal\Core\Render\Renderer->doRender(Array, ) (Line: 195) Drupal\Core\Render\Renderer->render(Array) (Line: 490) Drupal\Core\Template\TwigExtension->escapeFilter(Object, Array, 'html', NULL, 1) (Line: 211) __TwigTemplate_609be39c861ea6de17b6cbe2865d8619637a50a97ff3aa65bfd71eea363e215e->block_content(Array, Array) (Line: 215) Twig_Template->displayBlock('content', Array, Array) (Line: 160) __TwigTemplate_609be39c861ea6de17b6cbe2865d8619637a50a97ff3aa65bfd71eea363e215e->block_main(Array, Array) (Line: 215) Twig_Template->displayBlock('main', Array, Array) (Line: 60) __TwigTemplate_609be39c861ea6de17b6cbe2865d8619637a50a97ff3aa65bfd71eea363e215e->doDisplay(Array, Array) (Line: 432) Twig_Template->displayWithErrorHandling(Array, Array) (Line: 403) Twig_Template->display(Array) (Line: 411) Twig_Template->render(Array) (Line: 64) twig_render_template('themes/elections_theme/templates/page.html.twig', Array) (Line: 384) Drupal\Core\Theme\ThemeManager->render('page', Array) (Line: 437) Drupal\Core\Render\Renderer->doRender(Array, ) (Line: 195) Drupal\Core\Render\Renderer->render(Array) (Line: 490) Drupal\Core\Template\TwigExtension->escapeFilter(Object, Array, 'html', NULL, 1) (Line: 88) __TwigTemplate_4412c3ba540fa7bbb59a0fe3ac63352e1a0fbde780c5bf73ff49c920397194cb->doDisplay(Array, Array) (Line: 432) Twig_Template->displayWithErrorHandling(Array, Array) (Line: 403) Twig_Template->display(Array) (Line: 411) Twig_Template->render(Array) (Line: 64) twig_render_template('themes/elections_theme/templates/html.html.twig', Array) (Line: 384) Drupal\Core\Theme\ThemeManager->render('html', Array) (Line: 437) Drupal\Core\Render\Renderer->doRender(Array, ) (Line: 195) Drupal\Core\Render\Renderer->render(Array) (Line: 147) Drupal\Core\Render\MainContent\HtmlRenderer->Drupal\Core\Render\MainContent\{closure}() (Line: 582) Drupal\Core\Render\Renderer->executeInRenderContext(Object, Object) (Line: 148) Drupal\Core\Render\MainContent\HtmlRenderer->renderResponse(Array, Object, Object) (Line: 90) Drupal\Core\EventSubscriber\MainContentViewSubscriber->onViewRenderArray(Object, 'kernel.view', Object) call_user_func(Array, Object, 'kernel.view', Object) (Line: 111) Drupal\Component\EventDispatcher\ContainerAwareEventDispatcher->dispatch('kernel.view', Object) (Line: 156) Symfony\Component\HttpKernel\HttpKernel->handleRaw(Object, 1) (Line: 68) Symfony\Component\HttpKernel\HttpKernel->handle(Object, 1, 1) (Line: 57) Drupal\Core\StackMiddleware\Session->handle(Object, 1, 1) (Line: 47) Drupal\Core\StackMiddleware\KernelPreHandle->handle(Object, 1, 1) (Line: 47) Drupal\Core\StackMiddleware\ReverseProxyMiddleware->handle(Object, 1, 1) (Line: 52) Drupal\Core\StackMiddleware\NegotiationMiddleware->handle(Object, 1, 1) (Line: 23) Stack\StackedHttpKernel->handle(Object, 1, 1) (Line: 665) Drupal\Core\DrupalKernel->handle(Object) (Line: 19) - Deprecated function: array_key_exists(): Using array_key_exists() on objects is deprecated. Use isset() or property_exists() instead in Drupal\Core\Controller\ArgumentResolver\RawParameterValueResolver->supports() (line 18 of core/lib/Drupal/Core/Controller/ArgumentResolver/RawParameterValueResolver.php).
Drupal\Core\Controller\ArgumentResolver\RawParameterValueResolver->supports(Object, Object) (Line: 52) Symfony\Component\HttpKernel\Controller\ArgumentResolver->getArguments(Object, Array) (Line: 193) Drupal\Core\Menu\LocalTaskManager->getTitle(Object) (Line: 343) Drupal\Core\Menu\LocalTaskManager->getTasksBuild('entity.node.canonical', Object) (Line: 378) Drupal\Core\Menu\LocalTaskManager->getLocalTasks('entity.node.canonical', 0) (Line: 95) Drupal\Core\Menu\Plugin\Block\LocalTasksBlock->build() (Line: 203) Drupal\block\BlockViewBuilder::preRender(Array) call_user_func('Drupal\block\BlockViewBuilder::preRender', Array) (Line: 378) Drupal\Core\Render\Renderer->doRender(Array) (Line: 450) Drupal\Core\Render\Renderer->doRender(Array, ) (Line: 195) Drupal\Core\Render\Renderer->render(Array) (Line: 490) Drupal\Core\Template\TwigExtension->escapeFilter(Object, Array, 'html', NULL, 1) (Line: 211) __TwigTemplate_609be39c861ea6de17b6cbe2865d8619637a50a97ff3aa65bfd71eea363e215e->block_content(Array, Array) (Line: 215) Twig_Template->displayBlock('content', Array, Array) (Line: 160) __TwigTemplate_609be39c861ea6de17b6cbe2865d8619637a50a97ff3aa65bfd71eea363e215e->block_main(Array, Array) (Line: 215) Twig_Template->displayBlock('main', Array, Array) (Line: 60) __TwigTemplate_609be39c861ea6de17b6cbe2865d8619637a50a97ff3aa65bfd71eea363e215e->doDisplay(Array, Array) (Line: 432) Twig_Template->displayWithErrorHandling(Array, Array) (Line: 403) Twig_Template->display(Array) (Line: 411) Twig_Template->render(Array) (Line: 64) twig_render_template('themes/elections_theme/templates/page.html.twig', Array) (Line: 384) Drupal\Core\Theme\ThemeManager->render('page', Array) (Line: 437) Drupal\Core\Render\Renderer->doRender(Array, ) (Line: 195) Drupal\Core\Render\Renderer->render(Array) (Line: 490) Drupal\Core\Template\TwigExtension->escapeFilter(Object, Array, 'html', NULL, 1) (Line: 88) __TwigTemplate_4412c3ba540fa7bbb59a0fe3ac63352e1a0fbde780c5bf73ff49c920397194cb->doDisplay(Array, Array) (Line: 432) Twig_Template->displayWithErrorHandling(Array, Array) (Line: 403) Twig_Template->display(Array) (Line: 411) Twig_Template->render(Array) (Line: 64) twig_render_template('themes/elections_theme/templates/html.html.twig', Array) (Line: 384) Drupal\Core\Theme\ThemeManager->render('html', Array) (Line: 437) Drupal\Core\Render\Renderer->doRender(Array, ) (Line: 195) Drupal\Core\Render\Renderer->render(Array) (Line: 147) Drupal\Core\Render\MainContent\HtmlRenderer->Drupal\Core\Render\MainContent\{closure}() (Line: 582) Drupal\Core\Render\Renderer->executeInRenderContext(Object, Object) (Line: 148) Drupal\Core\Render\MainContent\HtmlRenderer->renderResponse(Array, Object, Object) (Line: 90) Drupal\Core\EventSubscriber\MainContentViewSubscriber->onViewRenderArray(Object, 'kernel.view', Object) call_user_func(Array, Object, 'kernel.view', Object) (Line: 111) Drupal\Component\EventDispatcher\ContainerAwareEventDispatcher->dispatch('kernel.view', Object) (Line: 156) Symfony\Component\HttpKernel\HttpKernel->handleRaw(Object, 1) (Line: 68) Symfony\Component\HttpKernel\HttpKernel->handle(Object, 1, 1) (Line: 57) Drupal\Core\StackMiddleware\Session->handle(Object, 1, 1) (Line: 47) Drupal\Core\StackMiddleware\KernelPreHandle->handle(Object, 1, 1) (Line: 47) Drupal\Core\StackMiddleware\ReverseProxyMiddleware->handle(Object, 1, 1) (Line: 52) Drupal\Core\StackMiddleware\NegotiationMiddleware->handle(Object, 1, 1) (Line: 23) Stack\StackedHttpKernel->handle(Object, 1, 1) (Line: 665) Drupal\Core\DrupalKernel->handle(Object) (Line: 19) - Deprecated function: array_key_exists(): Using array_key_exists() on objects is deprecated. Use isset() or property_exists() instead in Drupal\Core\Controller\ArgumentResolver\RawParameterValueResolver->supports() (line 18 of core/lib/Drupal/Core/Controller/ArgumentResolver/RawParameterValueResolver.php).
Drupal\Core\Controller\ArgumentResolver\RawParameterValueResolver->supports(Object, Object) (Line: 52) Symfony\Component\HttpKernel\Controller\ArgumentResolver->getArguments(Object, Array) (Line: 193) Drupal\Core\Menu\LocalTaskManager->getTitle(Object) (Line: 343) Drupal\Core\Menu\LocalTaskManager->getTasksBuild('entity.node.canonical', Object) (Line: 378) Drupal\Core\Menu\LocalTaskManager->getLocalTasks('entity.node.canonical', 0) (Line: 95) Drupal\Core\Menu\Plugin\Block\LocalTasksBlock->build() (Line: 203) Drupal\block\BlockViewBuilder::preRender(Array) call_user_func('Drupal\block\BlockViewBuilder::preRender', Array) (Line: 378) Drupal\Core\Render\Renderer->doRender(Array) (Line: 450) Drupal\Core\Render\Renderer->doRender(Array, ) (Line: 195) Drupal\Core\Render\Renderer->render(Array) (Line: 490) Drupal\Core\Template\TwigExtension->escapeFilter(Object, Array, 'html', NULL, 1) (Line: 211) __TwigTemplate_609be39c861ea6de17b6cbe2865d8619637a50a97ff3aa65bfd71eea363e215e->block_content(Array, Array) (Line: 215) Twig_Template->displayBlock('content', Array, Array) (Line: 160) __TwigTemplate_609be39c861ea6de17b6cbe2865d8619637a50a97ff3aa65bfd71eea363e215e->block_main(Array, Array) (Line: 215) Twig_Template->displayBlock('main', Array, Array) (Line: 60) __TwigTemplate_609be39c861ea6de17b6cbe2865d8619637a50a97ff3aa65bfd71eea363e215e->doDisplay(Array, Array) (Line: 432) Twig_Template->displayWithErrorHandling(Array, Array) (Line: 403) Twig_Template->display(Array) (Line: 411) Twig_Template->render(Array) (Line: 64) twig_render_template('themes/elections_theme/templates/page.html.twig', Array) (Line: 384) Drupal\Core\Theme\ThemeManager->render('page', Array) (Line: 437) Drupal\Core\Render\Renderer->doRender(Array, ) (Line: 195) Drupal\Core\Render\Renderer->render(Array) (Line: 490) Drupal\Core\Template\TwigExtension->escapeFilter(Object, Array, 'html', NULL, 1) (Line: 88) __TwigTemplate_4412c3ba540fa7bbb59a0fe3ac63352e1a0fbde780c5bf73ff49c920397194cb->doDisplay(Array, Array) (Line: 432) Twig_Template->displayWithErrorHandling(Array, Array) (Line: 403) Twig_Template->display(Array) (Line: 411) Twig_Template->render(Array) (Line: 64) twig_render_template('themes/elections_theme/templates/html.html.twig', Array) (Line: 384) Drupal\Core\Theme\ThemeManager->render('html', Array) (Line: 437) Drupal\Core\Render\Renderer->doRender(Array, ) (Line: 195) Drupal\Core\Render\Renderer->render(Array) (Line: 147) Drupal\Core\Render\MainContent\HtmlRenderer->Drupal\Core\Render\MainContent\{closure}() (Line: 582) Drupal\Core\Render\Renderer->executeInRenderContext(Object, Object) (Line: 148) Drupal\Core\Render\MainContent\HtmlRenderer->renderResponse(Array, Object, Object) (Line: 90) Drupal\Core\EventSubscriber\MainContentViewSubscriber->onViewRenderArray(Object, 'kernel.view', Object) call_user_func(Array, Object, 'kernel.view', Object) (Line: 111) Drupal\Component\EventDispatcher\ContainerAwareEventDispatcher->dispatch('kernel.view', Object) (Line: 156) Symfony\Component\HttpKernel\HttpKernel->handleRaw(Object, 1) (Line: 68) Symfony\Component\HttpKernel\HttpKernel->handle(Object, 1, 1) (Line: 57) Drupal\Core\StackMiddleware\Session->handle(Object, 1, 1) (Line: 47) Drupal\Core\StackMiddleware\KernelPreHandle->handle(Object, 1, 1) (Line: 47) Drupal\Core\StackMiddleware\ReverseProxyMiddleware->handle(Object, 1, 1) (Line: 52) Drupal\Core\StackMiddleware\NegotiationMiddleware->handle(Object, 1, 1) (Line: 23) Stack\StackedHttpKernel->handle(Object, 1, 1) (Line: 665) Drupal\Core\DrupalKernel->handle(Object) (Line: 19) - Deprecated function: array_key_exists(): Using array_key_exists() on objects is deprecated. Use isset() or property_exists() instead in Drupal\Core\Controller\ArgumentResolver\RawParameterValueResolver->supports() (line 18 of core/lib/Drupal/Core/Controller/ArgumentResolver/RawParameterValueResolver.php).
Drupal\Core\Controller\ArgumentResolver\RawParameterValueResolver->supports(Object, Object) (Line: 52) Symfony\Component\HttpKernel\Controller\ArgumentResolver->getArguments(Object, Array) (Line: 193) Drupal\Core\Menu\LocalTaskManager->getTitle(Object) (Line: 343) Drupal\Core\Menu\LocalTaskManager->getTasksBuild('entity.node.canonical', Object) (Line: 378) Drupal\Core\Menu\LocalTaskManager->getLocalTasks('entity.node.canonical', 0) (Line: 95) Drupal\Core\Menu\Plugin\Block\LocalTasksBlock->build() (Line: 203) Drupal\block\BlockViewBuilder::preRender(Array) call_user_func('Drupal\block\BlockViewBuilder::preRender', Array) (Line: 378) Drupal\Core\Render\Renderer->doRender(Array) (Line: 450) Drupal\Core\Render\Renderer->doRender(Array, ) (Line: 195) Drupal\Core\Render\Renderer->render(Array) (Line: 490) Drupal\Core\Template\TwigExtension->escapeFilter(Object, Array, 'html', NULL, 1) (Line: 211) __TwigTemplate_609be39c861ea6de17b6cbe2865d8619637a50a97ff3aa65bfd71eea363e215e->block_content(Array, Array) (Line: 215) Twig_Template->displayBlock('content', Array, Array) (Line: 160) __TwigTemplate_609be39c861ea6de17b6cbe2865d8619637a50a97ff3aa65bfd71eea363e215e->block_main(Array, Array) (Line: 215) Twig_Template->displayBlock('main', Array, Array) (Line: 60) __TwigTemplate_609be39c861ea6de17b6cbe2865d8619637a50a97ff3aa65bfd71eea363e215e->doDisplay(Array, Array) (Line: 432) Twig_Template->displayWithErrorHandling(Array, Array) (Line: 403) Twig_Template->display(Array) (Line: 411) Twig_Template->render(Array) (Line: 64) twig_render_template('themes/elections_theme/templates/page.html.twig', Array) (Line: 384) Drupal\Core\Theme\ThemeManager->render('page', Array) (Line: 437) Drupal\Core\Render\Renderer->doRender(Array, ) (Line: 195) Drupal\Core\Render\Renderer->render(Array) (Line: 490) Drupal\Core\Template\TwigExtension->escapeFilter(Object, Array, 'html', NULL, 1) (Line: 88) __TwigTemplate_4412c3ba540fa7bbb59a0fe3ac63352e1a0fbde780c5bf73ff49c920397194cb->doDisplay(Array, Array) (Line: 432) Twig_Template->displayWithErrorHandling(Array, Array) (Line: 403) Twig_Template->display(Array) (Line: 411) Twig_Template->render(Array) (Line: 64) twig_render_template('themes/elections_theme/templates/html.html.twig', Array) (Line: 384) Drupal\Core\Theme\ThemeManager->render('html', Array) (Line: 437) Drupal\Core\Render\Renderer->doRender(Array, ) (Line: 195) Drupal\Core\Render\Renderer->render(Array) (Line: 147) Drupal\Core\Render\MainContent\HtmlRenderer->Drupal\Core\Render\MainContent\{closure}() (Line: 582) Drupal\Core\Render\Renderer->executeInRenderContext(Object, Object) (Line: 148) Drupal\Core\Render\MainContent\HtmlRenderer->renderResponse(Array, Object, Object) (Line: 90) Drupal\Core\EventSubscriber\MainContentViewSubscriber->onViewRenderArray(Object, 'kernel.view', Object) call_user_func(Array, Object, 'kernel.view', Object) (Line: 111) Drupal\Component\EventDispatcher\ContainerAwareEventDispatcher->dispatch('kernel.view', Object) (Line: 156) Symfony\Component\HttpKernel\HttpKernel->handleRaw(Object, 1) (Line: 68) Symfony\Component\HttpKernel\HttpKernel->handle(Object, 1, 1) (Line: 57) Drupal\Core\StackMiddleware\Session->handle(Object, 1, 1) (Line: 47) Drupal\Core\StackMiddleware\KernelPreHandle->handle(Object, 1, 1) (Line: 47) Drupal\Core\StackMiddleware\ReverseProxyMiddleware->handle(Object, 1, 1) (Line: 52) Drupal\Core\StackMiddleware\NegotiationMiddleware->handle(Object, 1, 1) (Line: 23) Stack\StackedHttpKernel->handle(Object, 1, 1) (Line: 665) Drupal\Core\DrupalKernel->handle(Object) (Line: 19) - Notice: Trying to access array offset on value of type int in Drupal\Core\Render\Element::children() (line 81 of core/lib/Drupal/Core/Render/Element.php).
Drupal\Core\Render\Element::children(Array) (Line: 250) Drupal\Core\Entity\EntityViewBuilder->buildMultiple(Array) (Line: 29) Drupal\block_content\BlockContentViewBuilder->viewMultiple(Array, 'full', NULL) (Line: 17) Drupal\block_content\BlockContentViewBuilder->view(Object, 'full') (Line: 187) Drupal\block_content\Plugin\Block\BlockContentBlock->build() (Line: 203) Drupal\block\BlockViewBuilder::preRender(Array) call_user_func('Drupal\block\BlockViewBuilder::preRender', Array) (Line: 378) Drupal\Core\Render\Renderer->doRender(Array) (Line: 450) Drupal\Core\Render\Renderer->doRender(Array, ) (Line: 195) Drupal\Core\Render\Renderer->render(Array) (Line: 490) Drupal\Core\Template\TwigExtension->escapeFilter(Object, Array, 'html', NULL, 1) (Line: 211) __TwigTemplate_609be39c861ea6de17b6cbe2865d8619637a50a97ff3aa65bfd71eea363e215e->block_content(Array, Array) (Line: 215) Twig_Template->displayBlock('content', Array, Array) (Line: 160) __TwigTemplate_609be39c861ea6de17b6cbe2865d8619637a50a97ff3aa65bfd71eea363e215e->block_main(Array, Array) (Line: 215) Twig_Template->displayBlock('main', Array, Array) (Line: 60) __TwigTemplate_609be39c861ea6de17b6cbe2865d8619637a50a97ff3aa65bfd71eea363e215e->doDisplay(Array, Array) (Line: 432) Twig_Template->displayWithErrorHandling(Array, Array) (Line: 403) Twig_Template->display(Array) (Line: 411) Twig_Template->render(Array) (Line: 64) twig_render_template('themes/elections_theme/templates/page.html.twig', Array) (Line: 384) Drupal\Core\Theme\ThemeManager->render('page', Array) (Line: 437) Drupal\Core\Render\Renderer->doRender(Array, ) (Line: 195) Drupal\Core\Render\Renderer->render(Array) (Line: 490) Drupal\Core\Template\TwigExtension->escapeFilter(Object, Array, 'html', NULL, 1) (Line: 88) __TwigTemplate_4412c3ba540fa7bbb59a0fe3ac63352e1a0fbde780c5bf73ff49c920397194cb->doDisplay(Array, Array) (Line: 432) Twig_Template->displayWithErrorHandling(Array, Array) (Line: 403) Twig_Template->display(Array) (Line: 411) Twig_Template->render(Array) (Line: 64) twig_render_template('themes/elections_theme/templates/html.html.twig', Array) (Line: 384) Drupal\Core\Theme\ThemeManager->render('html', Array) (Line: 437) Drupal\Core\Render\Renderer->doRender(Array, ) (Line: 195) Drupal\Core\Render\Renderer->render(Array) (Line: 147) Drupal\Core\Render\MainContent\HtmlRenderer->Drupal\Core\Render\MainContent\{closure}() (Line: 582) Drupal\Core\Render\Renderer->executeInRenderContext(Object, Object) (Line: 148) Drupal\Core\Render\MainContent\HtmlRenderer->renderResponse(Array, Object, Object) (Line: 90) Drupal\Core\EventSubscriber\MainContentViewSubscriber->onViewRenderArray(Object, 'kernel.view', Object) call_user_func(Array, Object, 'kernel.view', Object) (Line: 111) Drupal\Component\EventDispatcher\ContainerAwareEventDispatcher->dispatch('kernel.view', Object) (Line: 156) Symfony\Component\HttpKernel\HttpKernel->handleRaw(Object, 1) (Line: 68) Symfony\Component\HttpKernel\HttpKernel->handle(Object, 1, 1) (Line: 57) Drupal\Core\StackMiddleware\Session->handle(Object, 1, 1) (Line: 47) Drupal\Core\StackMiddleware\KernelPreHandle->handle(Object, 1, 1) (Line: 47) Drupal\Core\StackMiddleware\ReverseProxyMiddleware->handle(Object, 1, 1) (Line: 52) Drupal\Core\StackMiddleware\NegotiationMiddleware->handle(Object, 1, 1) (Line: 23) Stack\StackedHttpKernel->handle(Object, 1, 1) (Line: 665) Drupal\Core\DrupalKernel->handle(Object) (Line: 19) - Notice: Trying to access array offset on value of type int in Drupal\Core\Render\Element::children() (line 81 of core/lib/Drupal/Core/Render/Element.php).
Drupal\Core\Render\Element::children(Array) (Line: 84) Drupal\Core\Field\FormatterBase->view(Object, 'de') (Line: 262) Drupal\Core\Entity\Entity\EntityViewDisplay->buildMultiple(Array) (Line: 321) Drupal\Core\Entity\EntityViewBuilder->buildComponents(Array, Array, Array, 'full') (Line: 263) Drupal\Core\Entity\EntityViewBuilder->buildMultiple(Array) (Line: 29) Drupal\block_content\BlockContentViewBuilder->viewMultiple(Array, 'full', NULL) (Line: 17) Drupal\block_content\BlockContentViewBuilder->view(Object, 'full') (Line: 187) Drupal\block_content\Plugin\Block\BlockContentBlock->build() (Line: 203) Drupal\block\BlockViewBuilder::preRender(Array) call_user_func('Drupal\block\BlockViewBuilder::preRender', Array) (Line: 378) Drupal\Core\Render\Renderer->doRender(Array) (Line: 450) Drupal\Core\Render\Renderer->doRender(Array, ) (Line: 195) Drupal\Core\Render\Renderer->render(Array) (Line: 490) Drupal\Core\Template\TwigExtension->escapeFilter(Object, Array, 'html', NULL, 1) (Line: 211) __TwigTemplate_609be39c861ea6de17b6cbe2865d8619637a50a97ff3aa65bfd71eea363e215e->block_content(Array, Array) (Line: 215) Twig_Template->displayBlock('content', Array, Array) (Line: 160) __TwigTemplate_609be39c861ea6de17b6cbe2865d8619637a50a97ff3aa65bfd71eea363e215e->block_main(Array, Array) (Line: 215) Twig_Template->displayBlock('main', Array, Array) (Line: 60) __TwigTemplate_609be39c861ea6de17b6cbe2865d8619637a50a97ff3aa65bfd71eea363e215e->doDisplay(Array, Array) (Line: 432) Twig_Template->displayWithErrorHandling(Array, Array) (Line: 403) Twig_Template->display(Array) (Line: 411) Twig_Template->render(Array) (Line: 64) twig_render_template('themes/elections_theme/templates/page.html.twig', Array) (Line: 384) Drupal\Core\Theme\ThemeManager->render('page', Array) (Line: 437) Drupal\Core\Render\Renderer->doRender(Array, ) (Line: 195) Drupal\Core\Render\Renderer->render(Array) (Line: 490) Drupal\Core\Template\TwigExtension->escapeFilter(Object, Array, 'html', NULL, 1) (Line: 88) __TwigTemplate_4412c3ba540fa7bbb59a0fe3ac63352e1a0fbde780c5bf73ff49c920397194cb->doDisplay(Array, Array) (Line: 432) Twig_Template->displayWithErrorHandling(Array, Array) (Line: 403) Twig_Template->display(Array) (Line: 411) Twig_Template->render(Array) (Line: 64) twig_render_template('themes/elections_theme/templates/html.html.twig', Array) (Line: 384) Drupal\Core\Theme\ThemeManager->render('html', Array) (Line: 437) Drupal\Core\Render\Renderer->doRender(Array, ) (Line: 195) Drupal\Core\Render\Renderer->render(Array) (Line: 147) Drupal\Core\Render\MainContent\HtmlRenderer->Drupal\Core\Render\MainContent\{closure}() (Line: 582) Drupal\Core\Render\Renderer->executeInRenderContext(Object, Object) (Line: 148) Drupal\Core\Render\MainContent\HtmlRenderer->renderResponse(Array, Object, Object) (Line: 90) Drupal\Core\EventSubscriber\MainContentViewSubscriber->onViewRenderArray(Object, 'kernel.view', Object) call_user_func(Array, Object, 'kernel.view', Object) (Line: 111) Drupal\Component\EventDispatcher\ContainerAwareEventDispatcher->dispatch('kernel.view', Object) (Line: 156) Symfony\Component\HttpKernel\HttpKernel->handleRaw(Object, 1) (Line: 68) Symfony\Component\HttpKernel\HttpKernel->handle(Object, 1, 1) (Line: 57) Drupal\Core\StackMiddleware\Session->handle(Object, 1, 1) (Line: 47) Drupal\Core\StackMiddleware\KernelPreHandle->handle(Object, 1, 1) (Line: 47) Drupal\Core\StackMiddleware\ReverseProxyMiddleware->handle(Object, 1, 1) (Line: 52) Drupal\Core\StackMiddleware\NegotiationMiddleware->handle(Object, 1, 1) (Line: 23) Stack\StackedHttpKernel->handle(Object, 1, 1) (Line: 665) Drupal\Core\DrupalKernel->handle(Object) (Line: 19) - Notice: Trying to access array offset on value of type int in Drupal\Core\Render\Element::children() (line 81 of core/lib/Drupal/Core/Render/Element.php).
Drupal\Core\Render\Element::children(Array, 1) (Line: 408) Drupal\Core\Render\Renderer->doRender(Array) (Line: 450) Drupal\Core\Render\Renderer->doRender(Array, ) (Line: 195) Drupal\Core\Render\Renderer->render(Array) (Line: 490) Drupal\Core\Template\TwigExtension->escapeFilter(Object, Array, 'html', NULL, 1) (Line: 76) __TwigTemplate_21c26d7ff7ddf38a8a999e1f5a2063a501b7e57f0cb13933fe6241db90e52f3b->block_content(Array, Array) (Line: 215) Twig_Template->displayBlock('content', Array, Array) (Line: 65) __TwigTemplate_21c26d7ff7ddf38a8a999e1f5a2063a501b7e57f0cb13933fe6241db90e52f3b->doDisplay(Array, Array) (Line: 432) Twig_Template->displayWithErrorHandling(Array, Array) (Line: 403) Twig_Template->display(Array) (Line: 411) Twig_Template->render(Array) (Line: 64) twig_render_template('themes/bootstrap/templates/block/block.html.twig', Array) (Line: 384) Drupal\Core\Theme\ThemeManager->render('block', Array) (Line: 437) Drupal\Core\Render\Renderer->doRender(Array) (Line: 450) Drupal\Core\Render\Renderer->doRender(Array, ) (Line: 195) Drupal\Core\Render\Renderer->render(Array) (Line: 490) Drupal\Core\Template\TwigExtension->escapeFilter(Object, Array, 'html', NULL, 1) (Line: 211) __TwigTemplate_609be39c861ea6de17b6cbe2865d8619637a50a97ff3aa65bfd71eea363e215e->block_content(Array, Array) (Line: 215) Twig_Template->displayBlock('content', Array, Array) (Line: 160) __TwigTemplate_609be39c861ea6de17b6cbe2865d8619637a50a97ff3aa65bfd71eea363e215e->block_main(Array, Array) (Line: 215) Twig_Template->displayBlock('main', Array, Array) (Line: 60) __TwigTemplate_609be39c861ea6de17b6cbe2865d8619637a50a97ff3aa65bfd71eea363e215e->doDisplay(Array, Array) (Line: 432) Twig_Template->displayWithErrorHandling(Array, Array) (Line: 403) Twig_Template->display(Array) (Line: 411) Twig_Template->render(Array) (Line: 64) twig_render_template('themes/elections_theme/templates/page.html.twig', Array) (Line: 384) Drupal\Core\Theme\ThemeManager->render('page', Array) (Line: 437) Drupal\Core\Render\Renderer->doRender(Array, ) (Line: 195) Drupal\Core\Render\Renderer->render(Array) (Line: 490) Drupal\Core\Template\TwigExtension->escapeFilter(Object, Array, 'html', NULL, 1) (Line: 88) __TwigTemplate_4412c3ba540fa7bbb59a0fe3ac63352e1a0fbde780c5bf73ff49c920397194cb->doDisplay(Array, Array) (Line: 432) Twig_Template->displayWithErrorHandling(Array, Array) (Line: 403) Twig_Template->display(Array) (Line: 411) Twig_Template->render(Array) (Line: 64) twig_render_template('themes/elections_theme/templates/html.html.twig', Array) (Line: 384) Drupal\Core\Theme\ThemeManager->render('html', Array) (Line: 437) Drupal\Core\Render\Renderer->doRender(Array, ) (Line: 195) Drupal\Core\Render\Renderer->render(Array) (Line: 147) Drupal\Core\Render\MainContent\HtmlRenderer->Drupal\Core\Render\MainContent\{closure}() (Line: 582) Drupal\Core\Render\Renderer->executeInRenderContext(Object, Object) (Line: 148) Drupal\Core\Render\MainContent\HtmlRenderer->renderResponse(Array, Object, Object) (Line: 90) Drupal\Core\EventSubscriber\MainContentViewSubscriber->onViewRenderArray(Object, 'kernel.view', Object) call_user_func(Array, Object, 'kernel.view', Object) (Line: 111) Drupal\Component\EventDispatcher\ContainerAwareEventDispatcher->dispatch('kernel.view', Object) (Line: 156) Symfony\Component\HttpKernel\HttpKernel->handleRaw(Object, 1) (Line: 68) Symfony\Component\HttpKernel\HttpKernel->handle(Object, 1, 1) (Line: 57) Drupal\Core\StackMiddleware\Session->handle(Object, 1, 1) (Line: 47) Drupal\Core\StackMiddleware\KernelPreHandle->handle(Object, 1, 1) (Line: 47) Drupal\Core\StackMiddleware\ReverseProxyMiddleware->handle(Object, 1, 1) (Line: 52) Drupal\Core\StackMiddleware\NegotiationMiddleware->handle(Object, 1, 1) (Line: 23) Stack\StackedHttpKernel->handle(Object, 1, 1) (Line: 665) Drupal\Core\DrupalKernel->handle(Object) (Line: 19) - Notice: Trying to access array offset on value of type int in Drupal\Core\Render\Element::children() (line 81 of core/lib/Drupal/Core/Render/Element.php).
Drupal\Core\Render\Element::children(Array) (Line: 250) Drupal\Core\Entity\EntityViewBuilder->buildMultiple(Array) (Line: 29) Drupal\block_content\BlockContentViewBuilder->viewMultiple(Array, 'full', NULL) (Line: 17) Drupal\block_content\BlockContentViewBuilder->view(Object, 'full') (Line: 187) Drupal\block_content\Plugin\Block\BlockContentBlock->build() (Line: 203) Drupal\block\BlockViewBuilder::preRender(Array) call_user_func('Drupal\block\BlockViewBuilder::preRender', Array) (Line: 378) Drupal\Core\Render\Renderer->doRender(Array) (Line: 450) Drupal\Core\Render\Renderer->doRender(Array, ) (Line: 195) Drupal\Core\Render\Renderer->render(Array) (Line: 490) Drupal\Core\Template\TwigExtension->escapeFilter(Object, Array, 'html', NULL, 1) (Line: 211) __TwigTemplate_609be39c861ea6de17b6cbe2865d8619637a50a97ff3aa65bfd71eea363e215e->block_content(Array, Array) (Line: 215) Twig_Template->displayBlock('content', Array, Array) (Line: 160) __TwigTemplate_609be39c861ea6de17b6cbe2865d8619637a50a97ff3aa65bfd71eea363e215e->block_main(Array, Array) (Line: 215) Twig_Template->displayBlock('main', Array, Array) (Line: 60) __TwigTemplate_609be39c861ea6de17b6cbe2865d8619637a50a97ff3aa65bfd71eea363e215e->doDisplay(Array, Array) (Line: 432) Twig_Template->displayWithErrorHandling(Array, Array) (Line: 403) Twig_Template->display(Array) (Line: 411) Twig_Template->render(Array) (Line: 64) twig_render_template('themes/elections_theme/templates/page.html.twig', Array) (Line: 384) Drupal\Core\Theme\ThemeManager->render('page', Array) (Line: 437) Drupal\Core\Render\Renderer->doRender(Array, ) (Line: 195) Drupal\Core\Render\Renderer->render(Array) (Line: 490) Drupal\Core\Template\TwigExtension->escapeFilter(Object, Array, 'html', NULL, 1) (Line: 88) __TwigTemplate_4412c3ba540fa7bbb59a0fe3ac63352e1a0fbde780c5bf73ff49c920397194cb->doDisplay(Array, Array) (Line: 432) Twig_Template->displayWithErrorHandling(Array, Array) (Line: 403) Twig_Template->display(Array) (Line: 411) Twig_Template->render(Array) (Line: 64) twig_render_template('themes/elections_theme/templates/html.html.twig', Array) (Line: 384) Drupal\Core\Theme\ThemeManager->render('html', Array) (Line: 437) Drupal\Core\Render\Renderer->doRender(Array, ) (Line: 195) Drupal\Core\Render\Renderer->render(Array) (Line: 147) Drupal\Core\Render\MainContent\HtmlRenderer->Drupal\Core\Render\MainContent\{closure}() (Line: 582) Drupal\Core\Render\Renderer->executeInRenderContext(Object, Object) (Line: 148) Drupal\Core\Render\MainContent\HtmlRenderer->renderResponse(Array, Object, Object) (Line: 90) Drupal\Core\EventSubscriber\MainContentViewSubscriber->onViewRenderArray(Object, 'kernel.view', Object) call_user_func(Array, Object, 'kernel.view', Object) (Line: 111) Drupal\Component\EventDispatcher\ContainerAwareEventDispatcher->dispatch('kernel.view', Object) (Line: 156) Symfony\Component\HttpKernel\HttpKernel->handleRaw(Object, 1) (Line: 68) Symfony\Component\HttpKernel\HttpKernel->handle(Object, 1, 1) (Line: 57) Drupal\Core\StackMiddleware\Session->handle(Object, 1, 1) (Line: 47) Drupal\Core\StackMiddleware\KernelPreHandle->handle(Object, 1, 1) (Line: 47) Drupal\Core\StackMiddleware\ReverseProxyMiddleware->handle(Object, 1, 1) (Line: 52) Drupal\Core\StackMiddleware\NegotiationMiddleware->handle(Object, 1, 1) (Line: 23) Stack\StackedHttpKernel->handle(Object, 1, 1) (Line: 665) Drupal\Core\DrupalKernel->handle(Object) (Line: 19) - Notice: Trying to access array offset on value of type int in Drupal\Core\Render\Element::children() (line 81 of core/lib/Drupal/Core/Render/Element.php).
Drupal\Core\Render\Element::children(Array) (Line: 84) Drupal\Core\Field\FormatterBase->view(Object, 'de') (Line: 262) Drupal\Core\Entity\Entity\EntityViewDisplay->buildMultiple(Array) (Line: 321) Drupal\Core\Entity\EntityViewBuilder->buildComponents(Array, Array, Array, 'full') (Line: 263) Drupal\Core\Entity\EntityViewBuilder->buildMultiple(Array) (Line: 29) Drupal\block_content\BlockContentViewBuilder->viewMultiple(Array, 'full', NULL) (Line: 17) Drupal\block_content\BlockContentViewBuilder->view(Object, 'full') (Line: 187) Drupal\block_content\Plugin\Block\BlockContentBlock->build() (Line: 203) Drupal\block\BlockViewBuilder::preRender(Array) call_user_func('Drupal\block\BlockViewBuilder::preRender', Array) (Line: 378) Drupal\Core\Render\Renderer->doRender(Array) (Line: 450) Drupal\Core\Render\Renderer->doRender(Array, ) (Line: 195) Drupal\Core\Render\Renderer->render(Array) (Line: 490) Drupal\Core\Template\TwigExtension->escapeFilter(Object, Array, 'html', NULL, 1) (Line: 211) __TwigTemplate_609be39c861ea6de17b6cbe2865d8619637a50a97ff3aa65bfd71eea363e215e->block_content(Array, Array) (Line: 215) Twig_Template->displayBlock('content', Array, Array) (Line: 160) __TwigTemplate_609be39c861ea6de17b6cbe2865d8619637a50a97ff3aa65bfd71eea363e215e->block_main(Array, Array) (Line: 215) Twig_Template->displayBlock('main', Array, Array) (Line: 60) __TwigTemplate_609be39c861ea6de17b6cbe2865d8619637a50a97ff3aa65bfd71eea363e215e->doDisplay(Array, Array) (Line: 432) Twig_Template->displayWithErrorHandling(Array, Array) (Line: 403) Twig_Template->display(Array) (Line: 411) Twig_Template->render(Array) (Line: 64) twig_render_template('themes/elections_theme/templates/page.html.twig', Array) (Line: 384) Drupal\Core\Theme\ThemeManager->render('page', Array) (Line: 437) Drupal\Core\Render\Renderer->doRender(Array, ) (Line: 195) Drupal\Core\Render\Renderer->render(Array) (Line: 490) Drupal\Core\Template\TwigExtension->escapeFilter(Object, Array, 'html', NULL, 1) (Line: 88) __TwigTemplate_4412c3ba540fa7bbb59a0fe3ac63352e1a0fbde780c5bf73ff49c920397194cb->doDisplay(Array, Array) (Line: 432) Twig_Template->displayWithErrorHandling(Array, Array) (Line: 403) Twig_Template->display(Array) (Line: 411) Twig_Template->render(Array) (Line: 64) twig_render_template('themes/elections_theme/templates/html.html.twig', Array) (Line: 384) Drupal\Core\Theme\ThemeManager->render('html', Array) (Line: 437) Drupal\Core\Render\Renderer->doRender(Array, ) (Line: 195) Drupal\Core\Render\Renderer->render(Array) (Line: 147) Drupal\Core\Render\MainContent\HtmlRenderer->Drupal\Core\Render\MainContent\{closure}() (Line: 582) Drupal\Core\Render\Renderer->executeInRenderContext(Object, Object) (Line: 148) Drupal\Core\Render\MainContent\HtmlRenderer->renderResponse(Array, Object, Object) (Line: 90) Drupal\Core\EventSubscriber\MainContentViewSubscriber->onViewRenderArray(Object, 'kernel.view', Object) call_user_func(Array, Object, 'kernel.view', Object) (Line: 111) Drupal\Component\EventDispatcher\ContainerAwareEventDispatcher->dispatch('kernel.view', Object) (Line: 156) Symfony\Component\HttpKernel\HttpKernel->handleRaw(Object, 1) (Line: 68) Symfony\Component\HttpKernel\HttpKernel->handle(Object, 1, 1) (Line: 57) Drupal\Core\StackMiddleware\Session->handle(Object, 1, 1) (Line: 47) Drupal\Core\StackMiddleware\KernelPreHandle->handle(Object, 1, 1) (Line: 47) Drupal\Core\StackMiddleware\ReverseProxyMiddleware->handle(Object, 1, 1) (Line: 52) Drupal\Core\StackMiddleware\NegotiationMiddleware->handle(Object, 1, 1) (Line: 23) Stack\StackedHttpKernel->handle(Object, 1, 1) (Line: 665) Drupal\Core\DrupalKernel->handle(Object) (Line: 19) - Notice: Trying to access array offset on value of type int in Drupal\Core\Render\Element::children() (line 81 of core/lib/Drupal/Core/Render/Element.php).
Drupal\Core\Render\Element::children(Array, 1) (Line: 408)
Drupal\Core\Render\Renderer->doRender(Array) (Line: 450)
Drupal\Core\Render\Renderer->doRender(Array, ) (Line: 195)
Drupal\Core\Render\Renderer->render(Array) (Line: 490)
Drupal\Core\Template\TwigExtension->escapeFilter(Object, Array, 'html', NULL, 1) (Line: 76)
__TwigTemplate_21c26d7ff7ddf38a8a999e1f5a2063a501b7e57f0cb13933fe6241db90e52f3b->block_content(Array, Array) (Line: 215)
Twig_Template->displayBlock('content', Array, Array) (Line: 65)
__TwigTemplate_21c26d7ff7ddf38a8a999e1f5a2063a501b7e57f0cb13933fe6241db90e52f3b->doDisplay(Array, Array) (Line: 432)
Twig_Template->displayWithErrorHandling(Array, Array) (Line: 403)
Twig_Template->display(Array) (Line: 411)
Twig_Template->render(Array) (Line: 64)
twig_render_template('themes/bootstrap/templates/block/block.html.twig', Array) (Line: 384)
Drupal\Core\Theme\ThemeManager->render('block', Array) (Line: 437)
Drupal\Core\Render\Renderer->doRender(Array) (Line: 450)
Drupal\Core\Render\Renderer->doRender(Array, ) (Line: 195)
Drupal\Core\Render\Renderer->render(Array) (Line: 490)
Drupal\Core\Template\TwigExtension->escapeFilter(Object, Array, 'html', NULL, 1) (Line: 211)
__TwigTemplate_609be39c861ea6de17b6cbe2865d8619637a50a97ff3aa65bfd71eea363e215e->block_content(Array, Array) (Line: 215)
Twig_Template->displayBlock('content', Array, Array) (Line: 160)
__TwigTemplate_609be39c861ea6de17b6cbe2865d8619637a50a97ff3aa65bfd71eea363e215e->block_main(Array, Array) (Line: 215)
Twig_Template->displayBlock('main', Array, Array) (Line: 60)
__TwigTemplate_609be39c861ea6de17b6cbe2865d8619637a50a97ff3aa65bfd71eea363e215e->doDisplay(Array, Array) (Line: 432)
Twig_Template->displayWithErrorHandling(Array, Array) (Line: 403)
Twig_Template->display(Array) (Line: 411)
Twig_Template->render(Array) (Line: 64)
twig_render_template('themes/elections_theme/templates/page.html.twig', Array) (Line: 384)
Drupal\Core\Theme\ThemeManager->render('page', Array) (Line: 437)
Drupal\Core\Render\Renderer->doRender(Array, ) (Line: 195)
Drupal\Core\Render\Renderer->render(Array) (Line: 490)
Drupal\Core\Template\TwigExtension->escapeFilter(Object, Array, 'html', NULL, 1) (Line: 88)
__TwigTemplate_4412c3ba540fa7bbb59a0fe3ac63352e1a0fbde780c5bf73ff49c920397194cb->doDisplay(Array, Array) (Line: 432)
Twig_Template->displayWithErrorHandling(Array, Array) (Line: 403)
Twig_Template->display(Array) (Line: 411)
Twig_Template->render(Array) (Line: 64)
twig_render_template('themes/elections_theme/templates/html.html.twig', Array) (Line: 384)
Drupal\Core\Theme\ThemeManager->render('html', Array) (Line: 437)
Drupal\Core\Render\Renderer->doRender(Array, ) (Line: 195)
Drupal\Core\Render\Renderer->render(Array) (Line: 147)
Drupal\Core\Render\MainContent\HtmlRenderer->Drupal\Core\Render\MainContent\{closure}() (Line: 582)
Drupal\Core\Render\Renderer->executeInRenderContext(Object, Object) (Line: 148)
Drupal\Core\Render\MainContent\HtmlRenderer->renderResponse(Array, Object, Object) (Line: 90)
Drupal\Core\EventSubscriber\MainContentViewSubscriber->onViewRenderArray(Object, 'kernel.view', Object)
call_user_func(Array, Object, 'kernel.view', Object) (Line: 111)
Drupal\Component\EventDispatcher\ContainerAwareEventDispatcher->dispatch('kernel.view', Object) (Line: 156)
Symfony\Component\HttpKernel\HttpKernel->handleRaw(Object, 1) (Line: 68)
Symfony\Component\HttpKernel\HttpKernel->handle(Object, 1, 1) (Line: 57)
Drupal\Core\StackMiddleware\Session->handle(Object, 1, 1) (Line: 47)
Drupal\Core\StackMiddleware\KernelPreHandle->handle(Object, 1, 1) (Line: 47)
Drupal\Core\StackMiddleware\ReverseProxyMiddleware->handle(Object, 1, 1) (Line: 52)
Drupal\Core\StackMiddleware\NegotiationMiddleware->handle(Object, 1, 1) (Line: 23)
Stack\StackedHttpKernel->handle(Object, 1, 1) (Line: 665)
Drupal\Core\DrupalKernel->handle(Object) (Line: 19)
Ergebnisse in Zahlen
Auf dieser Seite werden die Listenergebnisse angezeigt. Für nähere Details benutzen Sie das Dropdown-Menü.
Gemeinde La Louvière
Ausgezählte Büros : 27/27 (100.00%) – Aktualisiert am
Entwicklung der Büros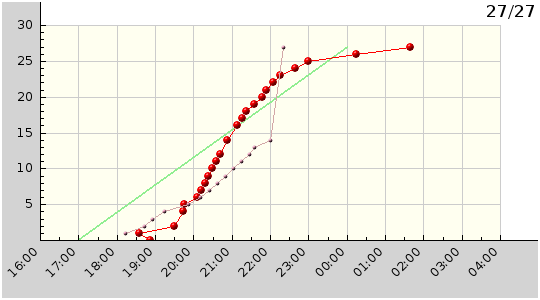
Entwicklung der Büros
Gemeinde La Louvière
Entwicklung 2012
Entwicklung 2018
Referenzentwicklung
| Wahlberechtigte | 2018 | 2012 | ||
|---|---|---|---|---|
| Total | 55.091 | 53.725 |
| Abgegebene Stimmzettel | 2018 | 2012 | %2018 | %2012 |
|---|---|---|---|---|
| Total | 48.422 | 47.138 | 87,89% | 87,74% |
| Weiß/ungültige Stimmen | 2018 | 2012 | %2018 | %2012 |
|---|---|---|---|---|
| Total | 5.226 | 4.001 | 10,79% | 8,49% |
| Gültige Stimmen | 2018 | 2012 | ||
|---|---|---|---|---|
| Total | 43.196 | 43.137 |